Richness and abundance of reef fish in the Caribbean of Guatemala using Baited Remote Underwater Video Stations
Richness and abundance of reef fish in the Caribbean of Guatemala using Baited Remote Underwater Video Stations
*Francisco Polanco-Vásquez1, 2, Alerick Pacay2, José R. Ortíz-Aldana1, Ana Hacohen-Domené2, Cristopher Avalos-Castillo2
1 Instituto de Investigaciones Hidrobiológicas, Centro de Estudios del Mar y Acuicultura (Cema), Universidad de San Carlos de Guatemala (Usac); 2 Fundación Mundo Azul (FUNMZ), Guatemala
*Author to whom correspondence should be addressed: polancoenca@gmail.com
Received: March 15, 2017 / 1st revision: March 20, 2018 / 2nd revision: May 31, 2018 / Accepted: September 24, 2018
Abstract
The Guatemalan Caribbean Sea forms part of the Mesoamerican Reef System (MAR), which harbors a great marine biodiversity. These populations are important for the wellness of humans who live in communities at coastal areas located in the MAR region, and who directly or indirectly depend on these resources to survive and thrive. The main objective of this study was to determine not only species richness and abundance of herbivorous fish, but also those who are attracted by shad and tuna bait when used in the Baited Remote Underwater Video Stations (BRUVS) in sites with coral reef presence. Monitoring was held at seven spots located outside Bahía de Amatique, Izabal, in April, June and September 2016. In 21 sets of BRUVS, 26.06 h of video were recorded, counting a total of 778 organisms which belongs to two classes, 20 families, 31 genera and 59 species. The most abundant species were Scarus spp. (19.67 %), Clepticus parrae (9.64 %), Aluterus scriptus (6.04 %), Scarus iserti (5.14 %) and Caranx ruber (5.01 %). The sites that presented higher richness of species were Quetzalito 1 y 2 (p < 0.006 compared to the rest of the sampled sites). Quetzalito 1, 2 and King Fish showed higher abundance (p < .038) compared to the rest of the sites. Abundance per specie dendrogram showed five groups (Bray-Curtis similarity of 43 %). Finally, low presence of commercial fish species was seen at the seven monitored sites.
Keywords
Amatique Bay, Scaridae, Scarus, BRUVS.
Introduction
The Mesoamerican Reef System (MAR) is a living structure that extends for more than 1,000 km along the marine-coastal zone of its four member countries (Mexico, Belize, Guatemala and Honduras). This region is considered highly important, both biologically and socioeconomically, since it sustains a large part of the local economy of the coastal communities settled within the MAR (Kramer et al., 2015). The MAR is the second largest coral reef in the world and holds a wide variety of coastal ecosystems such as mangroves, seagrass beds, mud flats and coral reefs (Adams et al., 2006; Mumby et al., 2004; Vásquez, Vega, Montero, & Sosa, 2011).
Historically, scientific research on fish communities relied on invasive and destructive monitoring in order to reduce statistical sampling error (Ackerman & Bellwood, 2000). Later, these methods were replaced by dives, in which divers recorded abundance data and estimated fish sizes within the limits of established transects. However, several inconsistencies were detected regarding the abundance and size of the organisms, owing to variation in the criteria applied by the researchers (Harvey, Fletcher, Shortis, & Kendrick, 2004).
At present, there is no standardized non-invasive methodology that allows the effectiveness of conservation objectives to be evaluated and that can be applied and replicated in continuous monitoring within marine protected areas (De Vos, Götz, Winker, & Attwood, 2014). In this regard, the Baited Remote Underwater Video Stations (BRUVS) methodology is very useful, since it is efficient for the analysis of fish communities, requires less sampling effort than other methods and shows greater sensitivity in detecting statistical differences in the abundances of different communities (Bernard & Gotz, 2012; Harvey et al., 2012). In addition, using this methodology can reduce field time and the number of trained personnel required, and it may prove more efficient than the use of divers (Watson, Harvey, Anderson, & Kendrick, 2005).
BRUVS consist of a PVC structure that carries an underwater video camera and a metal bait mesh placed within the field of view of the camera. This methodology is used in sensitive marine habitats and in areas of complex bathymetry. It has also become a non-invasive sampling technique for reef fish, mainly where access with scuba diving equipment is difficult and where sampling could compromise the conservation objectives of the area or the reliability of the data (Cappo, Speare, & De´ath, 2004; De Vos et al., 2014). This methodology can be used to determine species richness in relation to the assemblage structure of the ichthyofauna in coral habitats (Cappo et al., 2004; Cappo, Stowar, Syms, Johansson, & Cooper, 2011; Meekan & Meeken, 2006).
Some authors have used this methodology and its unbaited variants to determine populations of both bony fishes and top predators in the MAR (Andradi-Brown et al., 2016b; Bond et al., 2012). This has made it possible to determine the presence-absence of these organisms in reef ecosystems, taking into account the sizes and abundance of different species.
The collapse of coral reefs in the Caribbean has been attributed in part to the overfishing that has historically occurred in the region (Newman, Paredes, Sala, & Jackson, 2006). In this sense, the main objective of the present study is to evaluate the abundance and richness of reef fish species, both herbivorous fish and species of commercial importance, at seven coral sites in the Caribbean Sea of Guatemala using the BRUVS methodology.
Materials and methods
Study area and sampling sites
The study was carried out at seven sites with coral reef presence in the Caribbean Sea of Guatemala, located at a depth range of 5-11 m, outside Amatique Bay: Quetzalito 1 (QUE1), Quetzalito 2 (QUE2), Motagüilla 1 (MOT1) and Motagüilla 2 (MOT2), which are reef ecosystems formed by valleys and ridges, and Cabo Tres Puntas 1 (CTP1), Cabo Tres Puntas 2 (CTP2) and King Fish (KIN), which are smaller reef patches. The sampled sites are open to fishing. All the sites were selected on the basis of the coral reef ecosystems present in the area (Figure 1).
In total, three sampling campaigns were carried out applying the BRUVS methodology in April, June and September 2016. All replicates were conducted in the morning, at each site at the same time of day and without randomization.
Description of the BRUVS
Portable GoPro Hero® 3 and 4 cameras were used, hooked onto a wooden board mounted on a triangular tripod-shaped structure built with polyvinyl chloride (PVC) pipes. To prevent the structure from moving, steel bars were placed at its base as ballast. The bait used during the monitoring was shad and tuna, placed at the far end of a 1.5 m long pipe, inside a bag made of metal mesh with a 2.5 cm opening. The BRUVS were attached to a 20 m long rope and a white buoy, and each unit was submerged for approximately one hour (Figure 2). Finally, the geographic coordinates were recorded at each sampling site.
The analysis was carried out by watching the videos with Windows Media Player© software. Video analysis began at minute five (5:00 min), the moment when the boat had already left the site. Once the hour of filming was completed, the team approached the site to retrieve the structure (Brooks, Sloman, Sims, & Danylchuk, 2011). The species observed in the videos were identified to the lowest possible taxon using reef fauna identification guides (Carpenter, 2002; Humann & DeLoach, 2014). Finally, the specimens of each observed species were counted in order to calculate species richness and abundance at each sampling site.
Statistical analysis
For each sampling site, every species appearing within the video frame was identified and counted. With this information, a Kruskal-Wallis (1952) analysis of variance was performed to establish whether there were significant differences in species abundance and richness among sites. In addition, the Friedman-Dunn (1937) test was used to establish which mean was higher or lower.
To calculate estimated diversity, the non-parametric diversity estimators Chao 1 and the Abundance-based Coverage Estimator (ACE) were used; likewise, a species accumulation curve was produced with the EstimateS software, Version 9.1.0 (Colwell, 2013).
To evaluate the heterogeneity of species among the sampling sites, the Shannon-Weaver diversity index (H’) and Pielou’s evenness index (J´) were analyzed with the PAST software (Statistical Version 1.93 for Windows XP). The Shannon-Weaver index (H) was also converted into the effective number of species using the following equation:
1D = exp (H’)
Cluster analysis was applied using the Bray-Curtis index to calculate and visualize the similarities among sites, taking into account the abundances of the organisms. The grouping of the sampling sites based on fish abundance was explored through non-metric multidimensional scaling (NMDS) analysis.
Results
A total of 26.06 h were recorded in 21 BRUVS sets distributed across seven sampling sites. A total of 778 organisms were counted, corresponding to two classes, 20 families, 31 genera and 59 fish species (Table 1). The most abundant species in the study were Scarus spp. (19.67 %), Clepticus parrae Bloch & Schneider, 1801 (9.64 %), Aluterus scriptus Osbeck, 1765 (6.04 %), Scarus iserti Bloch, 1789 (5.14 %) and Caranx ruber Bloch, 1793 (5.01 %). The remaining species each showed an individual percentage abundance below 5 %.
The expected richness of the species accumulation curve shows that with seven sampling sites the curve has not yet reached the asymptote; therefore, an increase in the number of species can be expected if the number of sampling sites were increased. The non-parametric diversity estimator ACE estimated 66 species, while Chao 1 estimated 63 species (Figure 3).
Significant differences were found in species richness (p = .006) and abundance (p = .038) among the sampling sites, but no differences were found for these same variables among the sampling months (p = > .999).
The sites with the highest richness were QUE1 and QUE2, with 35 and 28 fish species respectively, while CTP1 and MOT1 were the sites with the lowest number of species (14). With regard to abundance, QUE1 and QUE2 were the sites with the highest number of organisms, with 259 and 119 fish respectively, while CTP2 (54 organisms) and MOT1 (44 organisms) showed the lowest abundance (Table 2).
Table 1 Taxonomic list and abundance (No. of organisms/hour of recording) of reef fish in the Caribbean of Guatemala
| Family | Species | QUE1 | QUE2 | CTP1 | CTP2 | MOT1 | MOT2 | KING | Total |
|---|---|---|---|---|---|---|---|---|---|
| Acanthuridae | Acanthurus chirurgus | 6 | 9 | 2 | 0 | 3 | 5 | 0 | 25 |
| Acanthuridae | Acanthurus spp. | 1 | 3 | 0 | 0 | 0 | 0 | 0 | 4 |
| Acanthuridae | Acanthurus coeruleus | 8 | 0 | 0 | 0 | 0 | 0 | 0 | 8 |
| Acanthuridae | Acanthurus bahianus | 0 | 0 | 0 | 0 | 0 | 2 | 0 | 2 |
| Balistidae | Balistes vetula | 4 | 1 | 0 | 0 | 0 | 0 | 0 | 5 |
| Carangidae | Caranx crysos | 0 | 4 | 0 | 0 | 0 | 0 | 7 | 11 |
| Carangidae | Caranx latus | 0 | 0 | 0 | 0 | 0 | 2 | 0 | 2 |
| Carangidae | Caranx ruber | 13 | 5 | 14 | 0 | 4 | 0 | 3 | 39 |
| Carangidae | Caranx spp. | 4 | 0 | 0 | 0 | 0 | 1 | 2 | 7 |
| Chaetodontidae | Chaetodon striatus | 0 | 2 | 3 | 1 | 0 | 0 | 22 | 28 |
| Chaetodontidae | Chaetodon capistratus | 2 | 7 | 15 | 0 | 5 | 1 | 0 | 30 |
| Chaetodontidae | Chaetodon ocellatus | 1 | 2 | 0 | 0 | 0 | 4 | 0 | 7 |
| Haemulidae | Haemulon macrostomum | 0 | 0 | 0 | 1 | 0 | 3 | 5 | 9 |
| Haemulidae | Anisotremus virginicus | 0 | 0 | 0 | 0 | 0 | 0 | 3 | 3 |
| Haemulidae | Haemulon plumierii | 0 | 1 | 1 | 1 | 0 | 0 | 6 | 9 |
| Haemulidae | Haemulon album | 0 | 0 | 0 | 0 | 0 | 1 | 0 | 1 |
| Labridae | Halichoeres spp. | 5 | 2 | 0 | 1 | 4 | 6 | 0 | 18 |
| Labridae | Thalassoma bifasciatum | 9 | 8 | 0 | 2 | 2 | 0 | 0 | 21 |
| Labridae | Halichoeres radiatus | 0 | 0 | 0 | 0 | 1 | 0 | 0 | 1 |
| Labridae | Halichoeres bivittatus | 0 | 0 | 0 | 3 | 0 | 0 | 0 | 3 |
| Labridae | Halichoeres garnoti | 14 | 4 | 0 | 6 | 2 | 0 | 1 | 27 |
| Labridae | Clepticus parrae | 72 | 3 | 0 | 0 | 0 | 0 | 0 | 75 |
| Labridae | Bodianus rufus | 1 | 3 | 0 | 5 | 1 | 0 | 15 | 25 |
| Lutjanidae | Ocyurus chrysurus | 1 | 2 | 5 | 2 | 0 | 4 | 4 | 18 |
| Lutjanidae | Lutjanus apodus | 1 | 0 | 0 | 0 | 0 | 0 | 1 | 2 |
| Lutjanidae | Lutjanus synagris | 0 | 2 | 0 | 2 | 0 | 4 | 6 | 14 |
| Lutjanidae | Lutjanus analis | 3 | 2 | 0 | 2 | 0 | 0 | 0 | 7 |
| Lutjanidae | Lutjanus jocu | 1 | 0 | 0 | 0 | 1 | 0 | 0 | 2 |
| Lutjanidae | Lutjanus griseus | 0 | 0 | 0 | 0 | 0 | 1 | 2 | 3 |
| Lutjanidae | Lutjanus spp. | 0 | 0 | 0 | 1 | 0 | 4 | 1 | 6 |
| Lutjanidae | Lutjanus mahogoni | 0 | 0 | 2 | 0 | 0 | 0 | 1 | 3 |
| Malacanthidae | Malacanthus plumieri | 2 | 0 | 0 | 1 | 1 | 0 | 0 | 4 |
| Monacanthidae | Aluterus scriptus | 10 | 1 | 1 | 0 | 0 | 35 | 0 | 47 |
| Muraenidae | Gymnothorax moringa | 0 | 0 | 1 | 0 | 0 | 0 | 0 | 1 |
| Pomacantidae | Pomacanthus arcuatus | 0 | 1 | 2 | 0 | 3 | 4 | 6 | 16 |
| Pomacantidae | Pomacanthus paru | 4 | 3 | 0 | 1 | 0 | 0 | 3 | 11 |
| Pomacentridae | Holacanthus tricolor | 1 | 1 | 0 | 0 | 0 | 0 | 0 | 2 |
| Pomacentridae | Stegastes partitus | 1 | 4 | 0 | 0 | 0 | 0 | 0 | 5 |
| Pomacentridae | Stegastes planifrons | 3 | 0 | 0 | 0 | 0 | 0 | 0 | 3 |
| Scaridae | Scarus taeniopterus | 4 | 0 | 2 | 0 | 0 | 0 | 0 | 6 |
| Scaridae | Scarus iserti | 27 | 0 | 0 | 5 | 0 | 1 | 7 | 40 |
| Scaridae | Scarus spp. | 47 | 42 | 20 | 4 | 12 | 10 | 18 | 153 |
| Scaridae | Cryptotomus roseus | 0 | 0 | 0 | 0 | 0 | 0 | 1 | 1 |
| Scaridae | Sparisoma viride | 3 | 1 | 0 | 1 | 0 | 1 | 0 | 6 |
| Scaridae | Sparisoma chrysopterum | 0 | 2 | 0 | 0 | 0 | 0 | 0 | 2 |
| Scombridae | Acanthocybium solandri | 1 | 0 | 0 | 0 | 0 | 0 | 0 | 1 |
| Scorpaenidae | Pterois volitans | 1 | 0 | 0 | 0 | 0 | 0 | 0 | 1 |
| Serranidae | Mycteroperca bonaci | 2 | 0 | 0 | 0 | 0 | 0 | 0 | 2 |
| Serranidae | Cephalopholis cruentata | 1 | 0 | 3 | 8 | 0 | 3 | 1 | 16 |
| Serranidae | Cephalopholis spp. | 0 | 2 | 0 | 0 | 4 | 4 | 0 | 10 |
| Serranidae | Cephalopholis fulva | 0 | 1 | 0 | 1 | 0 | 0 | 0 | 2 |
| Serranidae | Epinephelus striatus | 0 | 0 | 0 | 0 | 0 | 0 | 1 | 1 |
| Serranidae | Epinephelus itajara | 2 | 0 | 0 | 0 | 0 | 0 | 0 | 2 |
| Serranidae | Hypoplectrus spp. | 0 | 0 | 0 | 0 | 0 | 0 | 1 | 1 |
| Serranidae | Mycteroperca spp. | 1 | 0 | 0 | 2 | 0 | 0 | 3 | 6 |
| Sphyraenidae | Sphyraena barracuda | 1 | 1 | 0 | 4 | 1 | 1 | 12 | 20 |
| Tetraodontidae | Canthigaster rostrata | 2 | 0 | 0 | 0 | 0 | 0 | 0 | 2 |
| Carcharhinidae | Carcharhinus spp. | 0 | 0 | 1 | 0 | 0 | 0 | 0 | 1 |
| Ostracidae | Lactophrys bicaudalis | 0 | 0 | 0 | 0 | 0 | 1 | 0 | 1 |
Table 2 Diversity indices for the sampling sites
| Site | Richness | Abundance | Shannon-Weaver | Dominance | Evenness | ens |
|---|---|---|---|---|---|---|
| QUE1 | 35 | 259 | 2.602 | 0.133 | 0.385 | 13.490 |
| QUE2 | 28 | 119 | 2.628 | 0.149 | 0.495 | 13.846 |
| CTP1 | 14 | 72 | 2.087 | 0.171 | 0.576 | 8.060 |
| CTP2 | 21 | 54 | 2.789 | 0.075 | 0.775 | 16.264 |
| MOT1 | 14 | 44 | 2.333 | 0.128 | 0.736 | 10.308 |
| MOT2 | 22 | 98 | 2.453 | 0.158 | 0.529 | 11.623 |
| KIN | 25 | 132 | 2.765 | 0.085 | 0.635 | 15.879 |
Note: Quetzalito 1 (QUE1), Quetzalito 2 (QUE2), Cabo Tres Puntas 1 (CTP1), Cabo Tres Puntas 2 (CTP2), Motaguilla 1 (MOT1), Motaguilla 2 (MOT2) and King Fish (KIN), ens (effective number of species).
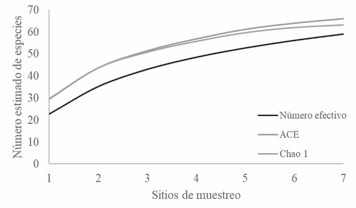
Figure 3. Observed and estimated species accumulation curve during the sampling period.
With regard to the Shannon-Weaver index, the sites with the highest diversity were CTP2 (2.789), KIN (2.765) and QUE2 (2.628). As for the evenness index, the highest values were found at CTP2 (0.775), MOT1 (0.736) and KIN (0.635).
The dendrogram derived from abundance per species for the sampling sites showed five groups (Bray-Curtis similarity of 43 %) (Figure 4). The sites QUE1 and QUE2 form one cluster, characterized by being the sites with the highest richness and abundance, mainly of Scarus spp., as well as the sites farthest from the coast. The second cluster comprises MOT1 and CTP1, which showed similar richness (14 species) and abundance values. On the other hand, MOT2, KIN and CTP2 did not group with other sites, presenting different characteristics with respect to abundance and richness (Figure 5).
The sites with the highest effective number of species were CTP2 (16.2), KIN (15.8), QUE1 (13.4) and QUE2 (13.8), while those with the lowest effective number of species were MOT2 (11.6), MOT1 (10.3) and CTP1 (8.06).
Discussion
The results obtained in this study are the first produced with the BRUVS methodology in the Caribbean Sea of Guatemala. The first research on reef fish in this area was carried out using the transect method, and the results show a biomass of 43 g/100 m2 of commercial fish and 433 g/100 m2 of herbivorous fish, indicating a critical status (McField et al., 2018).
The five most abundant families found during this research were Scaridae, Labridae, Chaetodontidae, Carangidae and Lutjanidae, the last two of which are considered to be of commercial importance. As for the most abundant species during this research, Scarus spp., C. parrae, A. scriptus, S. iserti and C. ruber were recorded. The pattern in the composition of the most abundant families and species found in this study is similar to that found on other reefs in the Caribbean (Andradi-Brown, Gres, Wright, Exton, & Rogers,, 2016a; Alemu, 2014; Núñez, González, Zarate, Hernández, & Arias, 2003).
During this study, the most abundant species with some degree of commercial importance were C. ruber, O. chrysurus and L. synagris, while the abundance reported here is lower than that found in a study carried out with the same methodology and in the same habitat (Andradi-Brown et al., 2016b). As for richness, this research obtained an average of 22 species per sampling site, whereas Andradi-Brown and colleagues (2016b) report a richness of 26 species per sampling site. This difference can be attributed to the fact that the sites evaluated in the Caribbean of Guatemala are subject to overfishing, while those reported in the aforementioned study do not experience fishing pressure.
The species accumulation curve did not reach its asymptote, which is consistent with the literature, where it is specified that one of the main problems of using BRUVS is that a high sampling effort is required to reach the asymptote of the species accumulation curve compared with other methodologies (Malcolm, Gladstone, Lindfield, Wraith, & Lynch, 2007). This is an important limitation of the BRUVS method that must be taken into account in future studies.
The results of this study made it possible to record significant differences in richness and abundance, with the sites QUE1, QUE2 and KIN showing the highest richness and abundance. This information can be used to propose fisheries management actions in the area at QUE1 and QUE2, since KIN is currently a zone with a ban on fishing gear, although the authorities face limitations in terms of control and surveillance of these areas, which translates into a high rate of illegal fishing; even so, these results show that the fisheries management actions applied at KIN have had some impact on the fish community.
The effective number of species shows that the two sites with the most species are CTP2 and KIN. This is a result of species dominance being lower at these sites compared with others; for example, QUE1 and QUE2, although they have a greater number of species, show some of the highest dominance indices. Jost (2006) notes that this “index is the number of species in a virtual community in which all species were equally common, preserving the average relative abundance of the community under study”. One of the advantages of using this index is that it allows us to evaluate the magnitude of change between communities (García-Morales, Moreno, & Bello-Gutiérrez, 2011).
The sites QUE1 and QUE2 formed a cluster located farther from the coast, with a lower incidence of fishing, and their reef formation consists of valleys and ridges, so these similarities could explain why they group together; the most abundant species at these sites were the genus Scarus and Clepticus parrae. MOT1 and CTP1, on the other hand, are sites closer to the coast and under greater fishing pressure; in terms of the ecosystem, the former consists of valleys and ridges and the latter of reef patches, and the most abundant species were the genus Scarus, C. ruber and C. capistratus.
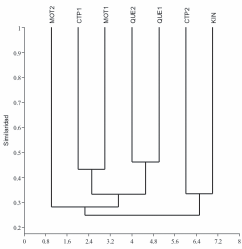
Figure 4. Bray-Curtis similarity of reef fish abundance. Quetzalito 1 (QUE1), Quetzalito 2 (QUE2), Cabo Tres Puntas 1 (CTP1), Cabo Tres Puntas 2 (CTP2), Motaguilla 1 (MOT1), Motaguilla 2 (MOT2) and King Fish (KIN)
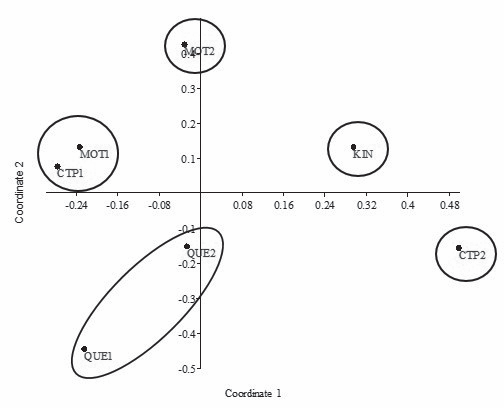
Figure 5. Non-metric multidimensional scaling (NMDS) plot of reef fish abundance. Quetzalito 1 (QUE1), Quetzalito 2 (QUE2), Cabo Tres Puntas 1 (CTP1), Cabo Tres Puntas 2 (CTP2), Motaguilla 1 (MOT1), Motaguilla 2 (MOT2) and King Fish (KIN).
Finally, the results obtained during this research show that most of the sites evaluated are exposed to overfishing, since the abundance of species of commercial importance is low and herbivorous species predominate. In the case of the sites QUE1 and QUE2, they have a lower incidence of fishing due to their distance from the coast, which makes access difficult for fishers; as for KIN, this site has legal protection regarding the use of fishing gear, which could help reduce the effects of fishing.
Acknowledgements
This research was co-funded by Digi-Usac-2016, Project: 4.8.26.7.41. Special thanks to the fishers of the community of El Quetzalito and to the National Council of Protected Areas (Conap) for their support during the study period.
References
Ackerman, J. L., & Bellwood, D. R. (2000). Reef fish assemblages: A re-evaluation using enclosed ro tenone stations. Marine Ecology Progress Series, 206(1), 227-237. doi:10.3354/meps206227 Adams, A., Dahlgren, C., Todd, G., Kendall, M., Lay man, C., Ley, J., … Serafy, J. (2006). Nursey function of tropical back-reef systems. Marine Ecology Progress Series, 206(3018), 287-301.
Alemu, J. (2014). Fish assemblages on fringing reefs in the southern Caribbean: Biodiversity, biomass and feeding types. Revista de Biología Tropical, 62(3), 169-181. doi:10.15517/rbt.v62i0.15912 Andradi-Brown, D. A., Gress, E., Wright, G., Exton, D. A., & Rogers, A. D. (2016a). Reef fish community biomass and trophic structure changes across shallow to upper-mesophotic reefs in the Mesoamerican Barrier Reef, Caribbean. PLoS ONE, 11(6), e0156641. doi:10.1371/journal.pone.0156641 Andradi-Brown, D. A., Macaya-Solís, C., Exton, D. A., Gress, E., Wright, G., & Rogers, A. D. (2016b). Assessing Caribbean shallow and mesophotic reef fish communities using Baited-Remote Underwa ter Video (BRUV) and Diver-Operated Video (DOV) survey techniques. PLoS ONE, 11(12), e0168235. doi:10.1371/journal.pone.0168235 Bernard, A., & Gotz, A. (2012). Bait increases the pre-cisión in coutn data from remote underwater vi deo for most subtidal reef fish in the warm-temperate Agulhas bioregion. Marine Ecology Progress Series, 471, 235-252. doi:10.3354/meps10039 Bond, M. E., Babcock, E. A., Pikitch, E. K., Abercrom bie, D. L., Lam, N. F., & Chapman, D. D. (2012). Reef sharks exhibit site-fidelity and higher relative abundance in marine reserves on the Mesoa merican Barrier Reef. PLoS ONE, 7(3), e32983. doi:10.1371/journal.pone.0032883.
Brooks, E., Sloman, K., Sims, D., & Danylchuk, J. (2011). Validating the use of baited remote underwater video surveys for assessing the diversity, distirubiton and abundance of sharks in the Bahamas. Endangered Species Reserarch, 13(3), 231-243. doi:10.3354/esr00331 Cappo, M., Speare, P., & De´ath, G. (2004). Comparison of baited remote underwater video stations (BRUVS) and prawn (shrimp) trawls for assessments of fish biodiversity in inter-reefal areas of the Great Barrier Reef Marine Park. Marine Biology and Ecology, 302(1), 123-152. doi: 10.1016/j.jembe.2003.10.006 Cappo, M., Stowar, M., Syms, C., Johansson, C., & Cooper, T. (2011). Fish-habitat asssociations in the region offshore from James Price Point- a rapid assessment using Baited Remote Underwater Video Stations (BRUVS). Journal of the Royal Society of Western Australia, 94, 303-321.
Carpenter, K. E. (Ed.). (2002). The living marine resources of the Western Central Atlantic. Rome: Food and Agriculture Organization of The United Nations Colwell, R. K. (2013). EstimateS: Statistical estimation of species richness and shared species from samples (Version 9) [Software de computación]. Recuperado de purl.oclc.org/estimates.
De Vos, L., Götz, A., Winker, H., & Attwood, C. G. (2014). Optimal BRUVS (baited remote underwater video system) survey design for reef fish monitoring in the Stilbaai Marine Protected Area. African Journal of Marine Science, 36(1), 1-10. doi:10.2989/1814232X.2013.873739 García-Morales, R., Moreno, C. E., & Bello-Gutiérrez, J. (2011). Renovando las medidas para evaluar la diversidad en comunidades ecológicas: El número de especies efectivas de murciélagos en el sureste de Tabasco, México. Therya, 2(3), 205-215. doi:10.12933/therya-11-47 Harvey, E., Fletcher, D., Shortis, M. R., & Kendrick, G. A. (2004). A comparison of underwater visual distance estimates made by scuba divers and a stereo-video system: implications for underwater visual census of reef fish abundance. Marine and Freshwater Research, 55(6), 573-580. doi:10.1071/MF03130 Harvey, E. S., Newman, S. J., McLean, D. L., Cappo, M., Meeuwig, J. J., & Skepper, C. L. (2012). Comparison of the relative efficiencies of stereo-BRU Vs and traps for sampling tropical continental shelf demersal fishes. Fisheries Research, 125- 126, 108-120. doi:10.1016/j.fishres.2012.01.026 Humann, P., & Deloach, N. (2002). Reef Fish Identification: Florida, Caribbean and Bahamas (3rd. ed.). Florida, United States: New World Publications.
Jost, L. (2006). Entropy and diversity. Oikos, 113(2), 363-375. doi:10.1111/j.2006.0030-1299.14714.x Kramer, P., McField, M., Álvarez, L., Drysdale, I., Rueda, M., Giró, A., & Pott, R. (2015). 2015 Report Card for the Mesoamerican Reef. Florida: Franklin Dodd Communications.
Malcolm, H., Gladstone, W., Lindfield, S., Wraith, J., & Lynch, T. (2007). Spatial and temporal variation in reef fish assemblages of marine parks in New South Wales, Australia-baited video observations. Marine Ecology Progress Series, 350, 277-290.
McField, M., Kramer, P., Álvarez, L., Drysdale, I., Rueda, M., Giro, A., & Soto, M. (2018). 2018 Report Cad for the Mesoamerican Reef. Florida: Franklin Dodd Communications.
Meekan, M., & Meekan, M. (2006). Surveys of shark and fin-fish abundance on reefs within the MOU74 Box and Rowley Shoals using baited remote underwater video systems. Queensland, Australia: Australian Institute of Marine Science.
Mumby, P. J., Edwards, A. J., Arias-González, J., Linde man, K. C., Blackwell, P. G., Gall, A., … Llewellyn, G. (2004). Mangroves enhance the biomass of coral reef fish communities in the Caribbean. Nature, 427(6974), 533-536. doi:10.1038/natu re02286 Newman, J., Paredes, A., Sala, E., & Jackson, J., (2006). Structure of Caribbean coral reef communities across a large gradient of fish biomass. Ecology Letters, 9(11), 1216-1227. doi: 10.1111/j.1461- 0248.2006.00976.x Núñez, L., Gonzales, C., Ruiz, M., Hernández, R., & Arias, E. (2003). Condition of coral reef ecosystems in central southern Quintana Roo (Part 2: Reef Fish Communities). Atoll Research Bulletin, 496(33), 598-610. doi:10.5479/si.00775630.496- 33.598 Vásquez, L., Vega, E., Montero, J., & Sosa, E., (2011). High species richness of early stages of fish in a locality of the Mesoamerican Barrier Reef System: A small-scale survey using different sampling gears. Biodiversity Conservation, 20, 2379-2389.
Watson, D. L., Harvey E. S., Anderson M. J., & Ken drick G. A. (2005). A comparison of temperate reef fish assemblages recorded by three underwater stereo-video techniques. Marine Biology, 148(2), 415–425. doi:10.1007/s00227-005-0090-6