Extinction risk, reconstructed catches and management of chondrichthyan fishes in the Western Central Atlantic Ocean
Extinction risk, reconstructed catches and management of chondrichthyan fishes in the Western Central Atlantic Ocean
Brendan S. Talwar, Brooke Anderson, Cristopher G. Avalos-Castillo, María del Pilar Blanco-Parra, Alejandra Briones, Diego Cardeñosa, John K. Carlson, Patricia Charvet, Charles F. Cotton, Zoe Crysler, Danielle H. Derrick, Michael R. Heithaus, Katelyn B. Herman, Olga Koubrak, David W. Kulka, Peter M. Kyne, Oscar M. Lasso-Alcalá, Paola A. Mejía-Falla, Jorge Manuel Morales-Saldaña, Beatriz Naranjo-Elizazu, Andrés F. Navia, Nathan Pacoureau, Juan Carlos Pérez-Jiménez, Riley A. Pollom, Cassandra L. Rigby, Gabriela Sofía Rincón-Vargas, Rima W. Jabado, Nicholas K. Dulvy y colaboradores
Fish and Fisheries, 2022. DOI: 10.1111/faf.12675. Received 24 January 2022; Revised 30 April 2022; Accepted 2 May 2022.
Correspondence: Brendan S. Talwar, Institute of Environment, Department of Biological Sciences, Florida International University, 3000 NE 151st Street, North Miami, FL 33181, USA. Email: talwar.brendan@gmail.com
Funding: Shark Conservation Fund.
Abstract
Chondrichthyan fishes are among the most threatened vertebrates on the planet because many species have slow life histories that are outpaced by intense fishing. The Western Central Atlantic Ocean, which includes the Greater Caribbean, is a hotspot of chondrichthyan biodiversity and abundance, but has been characterized by extensive shark and ray fisheries and a lack of sufficient data for effective management and conservation. To inform future research and management decisions, we analysed patterns in chondrichthyan extinction risk, reconstructed catches and management engagement in this region. We summarized the extinction risk of 180 sharks, rays and chimaeras, including 66 endemic and 14 near-endemic species, using contemporary IUCN Red List assessments. Over one-third (35.6%) were assessed as Vulnerable, Endangered or Critically Endangered, primarily due to overfishing. Reconstructed catches from 1950 to 2016 peaked in 1992, then declined by 40.2% thereafter. The United States, Venezuela and Mexico were responsible for most catches in the region and hosted the largest proportions of the regional distributions of threatened species, largely due to having extensive coastal habitats in their Exclusive Economic Zones. The quantity and taxonomic resolution of fisheries landings data were poor in much of the region, and national-level regulations varied widely across jurisdictions. Deepwater fisheries represent an emerging threat, although many deepwater chondrichthyans currently have refuge beyond the depths of most fisheries. Regional collaboration as well as effective and enforceable management informed by more complete fisheries data, particularly from small-scale fisheries, are required to protect and recover threatened species and ensure sustainable fisheries.
Keywords
Fisheries, IUCN Red List, marine policy, rays, sharks, threats
INTRODUCTION
Fishing has outpaced the slow life histories of many sharks and their relatives (class Chondrichthyes, hereafter ‘sharks and rays’; Cortés, 2000; Worm et al., 2013) and has led to an estimated one- third (37.5%) of sharks and rays being threatened with extinction (Dulvy, Pacoureau, et al., 2021). Oceanic sharks and rays present a striking example; between 1970 and 2018, an 18-fold increase in relative fishing pressure reduced their global abundance by 71% (Pacoureau et al., 2021). Sharks inhabiting coral reefs are similarly threatened, with fishing likely responsible for sharks being absent from almost 20% of reefs surveyed globally (MacNeil et al., 2020). The depletion of shark and ray populations could lead to ecosystem- level consequences (Burkholder et al., 2013; Estes et al., 2016; Ferretti et al., 2010) because many of these fishes are apex or mesopredators that range widely and may affect ecosystem pro- cesses through predation and associated risk effects, competition, nutrient transport and bioturbation (Flowers et al., 2021; Heithaus et al., 2008, 2010; Heupel et al., 2014).
In recent decades, increased concern for fisheries impacts on sharks and rays gave rise to numerous initiatives designed to stem or reverse population declines at the national and international level (Shiffman & Hammerschlag, 2016). In 1991, for example, the International Union for Conservation of Nature (IUCN) Species Survival Commission (SSC) Shark Specialist Group (SSG) was founded to promote the sustainable use and conservation of sharks and rays (Fowler et al., 2005), and, in 1993, the United States im- plemented its Fishery Management Plan for sharks in the Atlantic Ocean (NMFS, 1993). Additionally, in the late 1990s, the United Nations (UN) Food and Agriculture Organization (FAO) developed the International Plan of Action for Conservation and Management of Sharks (IPOA–Sharks), which recommended countries create and implement their own National Plans of Action for sharks and rays (NPOA–Sharks; FAO, 1999). Other management measures (e.g. trade restrictions) were introduced over the next twenty years, but their full implementation is a challenge (Lawson & Fordham, 2018), and their effectiveness remains to be demonstrated on a global scale (Davidson et al., 2016) despite some promising local outcomes (e.g. devil rays [Mobulidae]—Indonesia; Booth, Pooley, et al., 2020).
In the Greater Caribbean, robust shark and ray management is generally lacking (Davidson et al., 2016) outside of the United States (Fowler et al., 2005), and, one decade ago, management was described as a patchwork of inconsistent measures (Kyne et al., 2012). Further, the Greater Caribbean was recently one of the most data-deficient regions for sharks and rays in the world (Dulvy et al., 2014). According to the IUCN Red List of Threatened Species (IUCN Red List) in 2012, nearly half (47%) of the region's shark and ray species were assessed as Data Deficient, and nearly one in five (19%) were assessed in a threatened category, primarily due to overfishing (Kyne et al., 2012). Some historical accounts and archaeological data suggest that fishing had depleted large marine vertebrates in the Caribbean even before modern fishing technol- ogy and scientific research expanded in the mid-1900s (Jackson et al., 2001; McClenachan et al., 2006; Wing & Wing, 2001), al- though these conclusions are debated (e.g. see Baisre, 2010; McClenachan et al., 2010). As recently as the 1950s, however, sharks were still described as highly abundant (Viele, 1996; Ward- Paige et al., 2010), possibly illustrating the shifting baselines con- cept (Pauly, 1995).
Contemporary trends in shark abundance in the Greater Caribbean have been derived from time-series catch data from fisheries-independent surveys and US-based fisheries (including the pelagic longline fleet that covers much of the Caribbean). These data suggest declines in the abundance or size of some coastal (Cortés et al., 2002; Hayes et al., 2009; Powers et al., 2013) and oceanic sharks (Baum & Blanchard, 2010; Cortés et al., 2007; Jiao et al., 2009), particularly following intense fishing in the 1980s (Bonfil, 1997; Castro, 2013; Musick et al., 1993). The magnitudes of some widely- reported declines in the region's shark abundance are debated (see Baum et al., 2003; Baum & Myers, 2004; Burgess et al., 2005). Fisher surveys (Graham, 2007) and spatial variation in relative abundance also suggest fishing caused declines in some coastal shark popu- lations. Notably, abundance is often highest in heavily managed Exclusive Economic Zones (EEZs; MacNeil et al., 2020), marine re- serves (Bond et al., 2012; MacNeil et al., 2020), shark sanctuaries (Clementi et al., 2021) and remote areas far from human population centres (Ward-Paige et al., 2010). There are, however, signs of recent stability and/or recovery in some better-studied shark populations in the United States (Carlson et al., 2012; Peterson et al., 2017), The Bahamas (Hansell et al., 2018; Talwar et al., 2020) and Belize (Bond et al., 2017; Flowers et al., 2022), largely due to targeted manage- ment that began in the 1990s (Castro, 2013; Ward-Paige, 2017). Otherwise, a lack of data has challenged the assessment of shark population trends.
Ray (superorder Batoidea) population trends are poorly known in the Greater Caribbean and, for coastal species, trends vary spatially. For example, precipitous declines in sawfish (Pristidae) abundance are well documented across the entire region (Bonfil et al., 2017; Fernandez-Carvalho et al., 2014; Thorson, 1982), but at least one highly managed, well-studied population of Smalltooth Sawfish (Pristis pectinata, Pristidae) is stable and likely recovering in the United States (Brame et al., 2019). Additionally, diver observa- tions from 1994 to 2007 suggested that Yellow Stingray (Urobatis jamaicensis, Urotrygonidae) abundance declined on coral reefs but increased in some areas where predator populations were over- fished (e.g. Jamaica; Ward-Paige et al., 2011). Important ray (and shark) habitats, such as coral reef, seagrass and mangrove ecosys- tems (White & Sommerville, 2010), have also been degraded in the Greater Caribbean (Jackson et al., 2014; Polidoro et al., 2010; Waycott et al., 2009), which can lead to range contractions and in- creased extinction risk (Yan et al., 2021).
Chimaera (i.e. ghost shark, order Chimaeriformes) population trends are unknown in the Greater Caribbean, but chimaeras typically reside in deep offshore waters, are caught as bycatch, and have little commercial value (Finucci et al., 2021). Globally, their contribution to total chondrichthyan catches is very low (Dulvy et al., 2014). Further, chimaeras primarily reside at depths beyond the maximum depth of most Caribbean fisheries (Finucci et al., 2021). Their populations, along with the populations of deepwater sharks and rays, are prob- ably stable as a result (Dulvy et al., 2014), but remain understudied.
Recently, there have been efforts to reduce data deficiency and improve management for sharks and rays in this region. In 2017, the FAO Western Central Atlantic Fishery Commission (WECAFC), a regional fisheries advisory body that hosts members that fish or are located in FAO Major Fishing Area 31 (Western Central Atlantic; WCA) and the northern part of FAO Major Fishing Area 41 (Southwest Atlantic), convened the first meeting of the working group on shark and ray conservation and management. The work- ing group highlighted the need to coordinate national and regional management and made several specific recommendations regarding shark and ray fisheries (WECAFC, 2018). It also reviewed a Regional Plan of Action (RPOA–Sharks), a regionally tailored version of the IPOA–Sharks meant to facilitate collaboration in research, data col- lection, and management. Formal adoption of the RPOA–Sharks was intended for early 2020 (WECAFC, 2019), but it remains in draft form at the time of this writing.
To inform future research and upcoming management decisions, we summarize updated global assessments of shark and ray extinc- tion risk for species found in the WCA using data from the IUCN SSC SSG's Global Shark Trends Project (Dulvy, Pacoureau, et al., 2021). We analyse extinction risk according to taxonomy, maximum depth of occurrence and trophic position. We then examine key threats, particularly fishing, and review current shark and ray management at the national (states and territories) and international level.
MATERIALS AND METHODS
Application of the IUCN Red List Categories and Criteria
Twenty regional experts and members of the IUCN SSC SSG met for five days at the Cape Eleuthera Institute in Eleuthera, The Bahamas in June 2019. The IUCN Red List Categories and Criteria (Version 3.1) were applied to 113 species of sharks and rays following the Guidelines for Using the IUCN Red List Categories and Criteria (IUCN, 2012; IUCN Standards and Petitions Subcommittee, 2019). Assessments were conducted at the global level (i.e. for the entire global population of each species). Data were collated on the taxonomy, distribution, population status, habitat and ecology, major threats, use and trade, and conservation measures for each species from peer-reviewed liter- ature, fisheries statistics, grey literature and consultation with species and fisheries experts. For details on each of the eight IUCN Red List Categories and the five Criteria used to assess each category of ex- tinction risk, see Mace et al. (2008), IUCN (2012), and IUCN Standards and Petitions Subcommittee (2019). Briefly, a species is Extinct (EX) when no individuals remain alive and Extinct in the Wild (EW) when it only survives in captivity or in naturalized populations outside its pre- vious range. Critically Endangered (CR) species face an extremely high risk of extinction in the wild; Endangered (EN) species face a very high risk of extinction in the wild; and Vulnerable (VU) species face a high risk of extinction in the wild. These CR, EN and VU species are consid- ered threatened. Near Threatened (NT) species are close to qualifying or are likely to qualify for a threatened category in the future, and Least Concern (LC) species are widespread or abundant taxa not cur- rently qualifying for, nor close to qualifying for, a threatened category. Data Deficient (DD) species lack sufficient information on either their distribution or population status to adequately assess their extinction risk and could potentially be LC, CR or any category in between.
Draft assessments were prepared in the IUCN Species Information Service online database and reviewed by at least two experts trained in applying the IUCN Red List Categories and Criteria with knowledge of the species and fisheries at hand. A summary of the assessments was also provided to the entire IUCN SSC SSG (174 members) for their consult and input prior to submission to the IUCN Red List Unit (Cambridge, UK) for further review and quality checks. Assessments were then published on the IUCN Red List (version 2021-1, www.iucnr edlist.org; IUCN, 2021; see Data S3 in Dulvy, Pacoureau, et al., 2021). The assessments drafted at this workshop made up the majority of those included in this study; the remainder were conducted in the same manner at workshops elsewhere (e.g. oceanic species were assessed during a 2018 workshop in Dallas, Texas, USA; Pacoureau et al., 2021).
Geographic and taxonomic scope
The WCA extends from the eastern coast of French Guiana (5°00′N latitude) to the south-eastern coast of the United States (36°00′N lat- itude). It includes the Atlantic Ocean, Gulf of Mexico and Caribbean Sea from the east coast of North, Central and South America to 40°00′W longitude (Figure 1; FAO, 2021). It includes waters attrib- uted to 13 continental states, 13 island states and over 20 territo- ries (associated with Colombia, France, the Netherlands, the United Kingdom and the United States), encompassing 14.6 million km2.
We included all marine chondrichthyans assessed on the IUCN Red List that occur in the WCA, including residents and migrants. We excluded freshwater chondrichthyans because their fisheries and management are separate from marine fishes and focused our narra- tive less on chimaeras and oceanic sharks than other groups because they were evaluated in recent publications (Finucci et al., 2021; Pacoureau et al., 2021). We used the nomenclature and authorities listed in the online Catalog of Fishes (Eschmeyer et al., 2017), revi- sions of Sharks of the World (Ebert et al., 2013, 2021) for sharks and chimaeras, and Rays of the World (Last et al., 2016) for rays. We used only global assessments, all of which were available online (www. iucnredlist.org; IUCN, 2021). We therefore reported the global sta- tus of species occurring in the WCA rather than region-specific sta- tus, although we note that the assessments of endemic species were limited to the WCA.
Analysing habitat, trophic level and threat data
We coded each species according to the IUCN Major Threats and Habitats Classification Schemes (http://www.iucnredlist.org/techn ical-documents/classification-schemes/habitats-classification-schem e-ver3 and http://www.iucnredlist.org/technical-documents/classifica tion-schemes/threats-classification-scheme) (Salafsky et al., 2008). Species were assigned to one or more of the following habitat clas- sifications according to their known depth distribution: deep benthic, oceanic, neritic, wetlands, intertidal and coastal/supratidal. We ex- tracted the maximum depth of each species' depth distribution from the IUCN Red List assessments and extracted trophic level estimates from FishBase (Froese & Pauly, 2021) for each species. We then used separate ANOVAs to test for differences in (1) maximum depth and (2) trophic level between categories of extinction risk. In both cases, model residuals failed the Shapiro–Wilk test of normality, and data transformation was not productive. We then used non-parametric Kruskal–Wallis tests and post hoc Dunn's tests to conduct these analy- ses. We accounted for multiple comparisons by adjusting p-values using the Benjamini–Hochberg method. Lastly, we coded threats to each species as either present or absent and summarized those threats for all species and then for threatened species only.
Species distributions and conservation responsibility
We mapped the distributions of sharks and rays in the WCA using IUCN Red List species distribution shapefiles that were built accord- ing to taxonomic records summarized in FAO species catalogues (Dulvy et al., 2014; Dulvy, Pacoureau, et al., 2021), Rays of the World (Last et al., 2016), revisions of Sharks of the World (Ebert et al., 2013, 2021) and recent capture data, expert input and species checklists (Mejía-Falla et al., 2019; Tavares, 2019; Weigmann, 2016). Ranges were clipped to the minimum and maximum depth of each species. We set the maximum depth for species without a known depth range to the maximum confirmed depth of the family. We produced a species richness map for all sharks and rays, all endemic and near- endemic sharks and rays, and all threatened endemic and near- endemic sharks and rays by counting the number of polygons where species distribution maps overlapped. Due to imperfections in the underlying data, these counts should be interpreted for broadscale patterns only. Maps were created with QGIS3 (www.qgis.org). We estimated jurisdiction-specific conservation responsibility (CoR) to highlight the jurisdictions with the greatest regional re- sponsibility for conserving globally threatened sharks and rays as follows: we assigned threat scores to each species according to their extinction risk, where LC was assigned a zero, NT a one, VU a two, EN a three and CR a four. No species were assessed as EX or EW. For each jurisdiction (including all countries as well as international waters), we multiplied the threat score of every species present by its proportional range within the WCA in that jurisdiction (Kyne et al., 2020; Rodrigues et al., 2014). We took the sum of those values for each jurisdiction to calculate raw CoR values, then normalized them from 0 to 1 to compare CoR across jurisdictions (where a 1 was assigned to the jurisdiction with the highest CoR). We then produced a map displaying CoR using Jenks natural breaks classification, which reduces within-class variance and maximizes between-class vari- ance. We emphasize that CoR is a relative regional measure within the WCA based on extinction risk assigned at the global level; a juris- diction's CoR reflects the threat scores of species that occur there, not necessarily where those threats are most severe. 2.
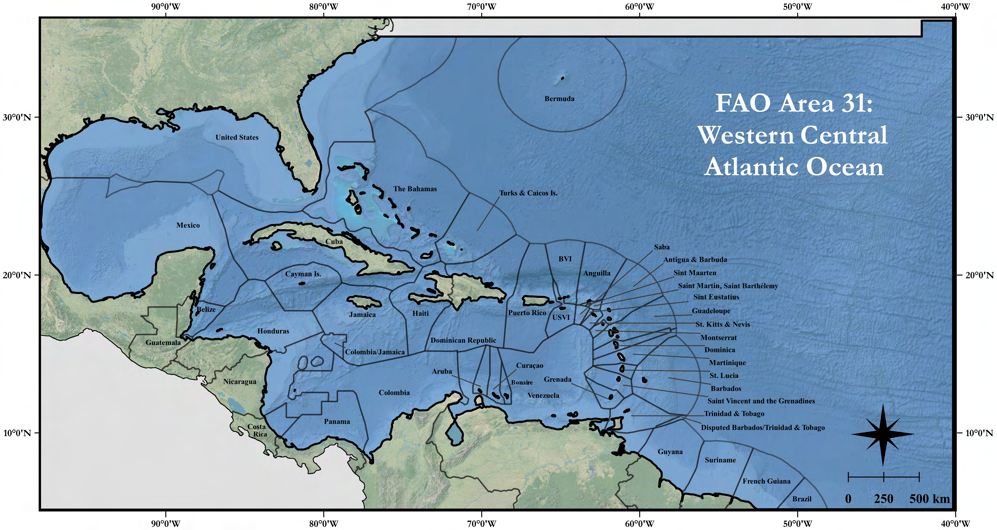
Figure 1. Map of the Western Central Atlantic Ocean (United Nations Food and Agriculture Organization Major Fishing Area 31). National boundaries are dark grey (Claus et al., 2014). Areas outside of the Western Central Atlantic Ocean are shaded grey. BVI is British Virgin Islands, and USVI is U.S. Virgin Islands. Map base layer source: Esri® (Dulvy et al., 2014; Dulvy, Pacoureau, et al., 2021), Rays of the World (Last et al., 2016), revisions of Sharks of the World (Ebert et al., 2013, 2021) and recent capture data, expert input and species checklists (Mejía-Falla et al., 2019; Tavares, 2019; Weigmann, 2016). Ranges were clipped to the minimum and maximum depth of each species. We set the maximum depth for species without a known depth range to the maximum confirmed depth of the family. We produced a species richness map for all sharks and rays, all endemic and near- endemic sharks and rays, and all threatened endemic and near- endemic sharks and rays by counting the number of polygons where species distribution maps overlapped. Due to imperfections in the underlying data, these counts should be interpreted for broadscale patterns only. Maps were created with QGIS3 (www.qgis.org). We estimated jurisdiction-specific conservation responsibility (CoR) to highlight the jurisdictions with the greatest regional re- sponsibility for conserving globally threatened sharks and rays as follows: we assigned threat scores to each species according to their extinction risk, where LC was assigned a zero, NT a one, VU a two, EN a three and CR a four. No species were assessed as EX or EW. For each jurisdiction (including all countries as well as international waters), we multiplied the threat score of every species present by its proportional range within the WCA in that jurisdiction (Kyne et al., 2020; Rodrigues et al., 2014). We took the sum of those values for each jurisdiction to calculate raw CoR values, then normalized them from 0 to 1 to compare CoR across jurisdictions (where a 1 was assigned to the jurisdiction with the highest CoR). We then produced a map displaying CoR using Jenks natural breaks classification, which reduces within-class variance and maximizes between-class vari- ance. We emphasize that CoR is a relative regional measure within the WCA based on extinction risk assigned at the global level; a juris- diction's CoR reflects the threat scores of species that occur there, not necessarily where those threats are most severe.
Reconstructed fisheries catch data
We extracted reconstructed catch data from the Sea Around Us Project database (www.seaaroundus.org) to examine regional trends in shark and ray catches from 1950 to 2016 (Pauly et al., 2020). The Sea Around Us database provides estimates of unreported catches (e.g. discards, subsistence, recreational and small-scale catches) combined with official figures reported by member countries to the UN FAO (Zeller et al., 2016). We used data for the functional groups ‘small-to-medium sharks ≤90 cm’, ‘large sharks ≥90 cm’, ‘small-to- medium rays ≤90 cm’ and ‘large rays ≥90 cm’ within only the WCA and then examined patterns in catches over time by fishing entity (i.e. country), taxonomy and gear type (Pauly & Zeller, 2015). Many countries in the WCA have EEZs that extend into other regions, but we did not include catches from those regions (e.g. southern Brazil or the Pacific coast of Central American countries). We did include catches by foreign fleets (e.g. Spain). To visualize each country's proportional contribution to total historical catches in the WCA, we normalized total reconstructed catch from 0 to 1 (where a 1 was assigned to the country with the largest total shark and ray catch).
Management
We collated the most recent stock assessment results (June 2021) for sharks and rays in the WCA from the International Commission for the Conservation of Atlantic Tunas (ICCAT; https://www.iccat. int/Documents/Meetings/Docs/2017_SCRS_REP_ENG.pdf) and the United States' National Oceanic and Atmospheric Administration (https://www.fisheries.noaa.gov/national/population-assessment s/fishery-stock-status-updates). Assessments indicate a status of ‘overfishing’, ‘overfished’ or ‘unknown’, where overfishing refers to fishing mortality or total catch compromising a stock's capacity to continuously produce maximum sustainable yield, overfished refers to a stock having a low population size that threatens its ability to reach maximum sustainable yield, and unknown refers to a stock that lacks definitions of overfishing and/or overfished or lacks the data to make a determination (US Department of Commerce, 2016).
We assessed each country's Management Engagement (ME; 0%–100%) with the following 13 tools (assigned present or absent): • Fishing and Finning (3 tools): a ban on shark fishing; a ban on ray fishing; a ban on finning (e.g. a requirement to land fins with associated carcasses or naturally attached); • UN FAO Plans (2 tools): NPOA–Sharks or RPOA–Sharks; UN FAO National or Regional Plan of Action to Prevent, Deter and Eliminate Illegal, Unreported and Unregulated (IUU) Fishing (NPOA–IUU or RPOA–IUU); • Other Regulations (1 tool): a single category that included time/ area closures, a ban on exports or imports of shark or ray products, species-specific measures or gear restrictions relevant to sharks and rays; • Party/Signatory/Cooperator to (7 tools): WECAFC; ICCAT; Convention on International Trade in Endangered Species of Wild Flora and Fauna (CITES); Convention on the Conservation of Migratory Species of Wild Animals (CMS); CMS Memorandum of Understanding–Sharks (CMS Sharks MoU); Protocol for Specially Protected Areas and Wildlife (SPAW) to the Convention for the Protection and Development of the Marine Environment of the Wider Caribbean Region; Agreement on Port State Measures to Prevent, Deter and Eliminate IUU Fishing (PSM).
We collected this information by searching the scientific and grey literature, UN FAO documents, and news sources. We relied largely on summaries in other reports (Baker-Médard & Faber, 2020; Koubrak et al., 2021; Kyne et al., 2012; Ward-Paige, 2017; Ward- Paige & Worm, 2017; WECAFC, 2018). Where a country's status was unclear or incomplete, we contacted in-country representatives for additional information. In a few cases, all parties were unsure of the status of a country relative to a management tool, in which case we used our best judgment in assigning status. Thus, this sum- mary represents our best effort at collating these data, but it may contain errors, particularly where complex overlap occurs between island, national and international jurisdictions (e.g. Kingdom of the Netherlands). We recognize that these 13 management tools are not equivalent, and, in some cases, their presence could lead to unin- tended negative consequences (Castellanos-Galindo et al., 2021). We also used linear regression to analyse the relationships between CoR, total reconstructed catch and ME, where a p-value < .05 was considered significant. We conducted all analyses in R Version 3.6.3 (R Core Team, 2021).
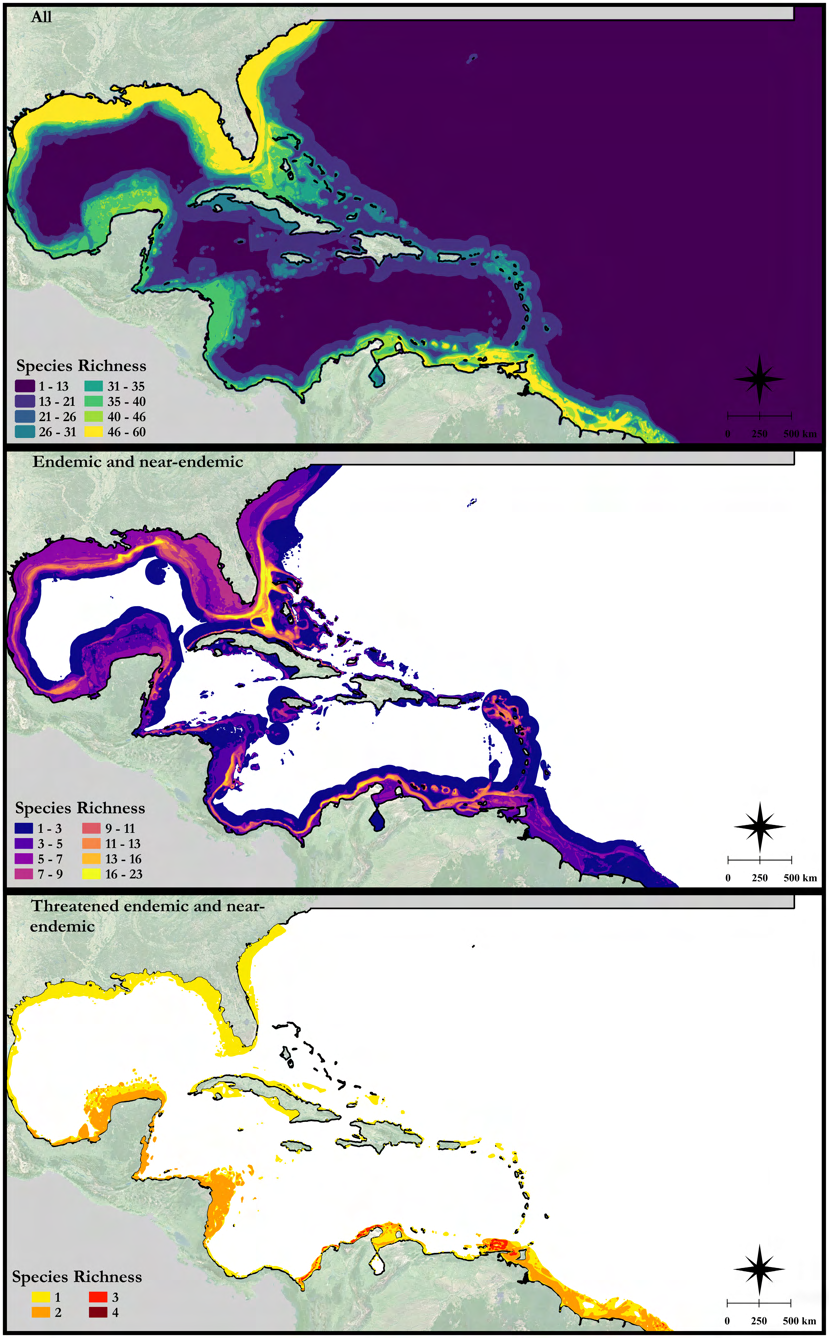
Figure 2. (a) Chondrichthyan species richness, (b) endemic and near-endemic chondrichthyan species richness, and (c) threatened (i.e. assessed as Vulnerable, Endangered or Critically Endangered on the IUCN Red List of Threatened Species) endemic and near-endemic chondrichthyan species richness in the Western Central Atlantic Ocean based on species distribution maps from the IUCN Red List database (IUCN, 2021). Areas outside of the Western Central Atlantic Ocean are shaded grey. Map base layer source: Esri® for additional information. In a few cases, all parties were unsure of the status of a country relative to a management tool, in which case we used our best judgment in assigning status. Thus, this sum- mary represents our best effort at collating these data, but it may contain errors, particularly where complex overlap occurs between island, national and international jurisdictions (e.g. Kingdom of the Netherlands). We recognize that these 13 management tools are not equivalent, and, in some cases, their presence could lead to unin- tended negative consequences (Castellanos-Galindo et al., 2021). We also used linear regression to analyse the relationships between CoR, total reconstructed catch and ME, where a p-value < .05 was considered significant. We conducted all analyses in R Version 3.6.3 (R Core Team, 2021).
RESULTS
Species diversity
We identified 180 assessed shark and ray species in the WCA, which represent 15% of the 1199 species assessed in the Global Shark Trends Project (Dulvy, Pacoureau, et al., 2021). This included 102 sharks, 72 rays, and 6 chimaeras from 12 orders, 46 families and 83 genera (Table S1). We identified 66 endemic species (36.7% of all species) and 14 near-endemic species (where a small portion of the species' range extended outside of the WCA; 7.8% of all species). Species richness was highest near the continental margins of North and South America and lowest in oceanic waters (Figure 2a). The neritic assemblage was dominated by Carcharhiniformes (36.5%, n = 35 of 96) and Myliobatiformes (24%, n = 23 of 96); the oceanic assemblage was dominated by Squaliformes (35.1%, n = 20 of 57) and Carcharhiniformes (26.3%, n = 15 of 57); and the deep slope was dominated by Rajiformes (34.7%, n = 35 of 101) and Squaliformes (23.8%, n = 24 of 101). 3.2 | Extinction risk: descriptive patterns in taxonomy, habitat associations and trophic level Over one-third (35.6%, n = 64 of 180) of all shark and ray species in the WCA were threatened with an elevated risk of extinction (Table 1). Twelve (6.7%) species were Critically Endangered; 25 (13.9%) spe- cies were Endangered; and 27 (15%) species were Vulnerable. Seventeen (9.4%) species were Near Threatened; 97 (53.9%) species were Least Concern; and two (1.1%) species were Data Deficient (Roughskin Spurdog [Cirrhigaleus asper, Squalidae] and Carolina Hammerhead [Sphyrna gilberti, Sphyrnidae]). All threatened species
All threatened species met Criterion A (“population reduction measured over the longer of ten years or three generations”) and sub-criterion A2 (“population reduction observed, estimated, inferred, or suspected in the past where the causes of reduction may not have ceased or may not be understood or may not be reversible”; IUCN, 2012). All NT species nearly met these same criteria. Either sub-criterion A2b (popula- tion reduction based on “an index of abundance appropriate to the taxon”) or A2d (population reduction based on “actual or potential levels of exploitation”; IUCN, 2012) was also cited in each of these assessments. No species met Criterion B (limited geographic range), Criterion C (small population size and decline), Criterion D (very small or restricted population) or Criterion E (quantitative analysis indicating a probability of extinction in the wild exceeding certain thresholds in the future). Around half (48.9%, n = 88) of all assessed species had a decreasing population trend; 70 (38.9%) were listed as stable; 8 (4.4%) had an increasing population trend; and 14 (7.8%) had an unknown population trend.
Contrary to the global pattern (Dulvy, Pacoureau, et al., 2021), sharks were more threatened than rays, with 40.2% (n = 41) of sharks and nearly one-third of rays (31.9%, n = 23) in the WCA threatened with an elevated risk of extinction (Figure 3). Seven (58.3%) of the twelve orders included at least one threatened species (Figure 4). All species in Rhinopristiformes (100%, n = 4) and Orectolobiformes (100%, n = 2) were threatened. Roughly two-thirds of species in Lamniformes (69.2%, n = 9) and Myliobatiformes (66.7%, n = 16) were threatened. Nearly half (46%, n = 23) of the species in Carcharhiniformes, the most speciose order in the WCA, were threatened. Notably, the second most speciose order, Rajiformes, included no threatened species. Of the 45 families in the region, 25 (55.6%) included at least one species in a threatened category.
Sixteen families included only species assessed as LC. Nearly all (95.7%, n = 22) species in Rajidae, the most speciose family in the region, were LC. Most (80.4%, n = 78) species assessed as LC were associated with depth ranges deeper than 200 m; only 11.9% (n = 12 of 101) of species found deeper than 200 m were threatened, the majority (58.3%, n = 7 of 12) of which were assessed as VU. Extinction risk varied with depth (Kruskal–Wallis χ22 = 21.06, df = 5, p < .05), where the maximum depth of LC species (906 ± 588 m; mean ± SD) was significantly greater than the maximum depth of CR (289 ± 390 m; mean ± SD; z = −3.63, p < .05) and VU species (613 ± 729 m, mean ± SD; z = 2.98, p < .05; Figure 5). Further, of 78 species with a stable or increasing population trend, 83.3% (n = 65 of 78) were associated with the ‘marine deep benthic’ habitat type. There were no differences in trophic levels reported in FishBase be- tween extinction risk categories (Kruskal–Wallis χ2 = 6.82, df = 5, p = .23). 3.
Table 1. The number and percentage of chondrichthyans found in the Western Central Atlantic Ocean by IUCN Red List of Threatened Species category. Totals for the threatened categories, which include Critically Endangered, Endangered and Vulnerable, appear in italics of 78) were associated with the ‘marine deep benthic’ habitat type. There were no differences in trophic levels reported in FishBase be- tween extinction risk categories (Kruskal–Wallis χ2 = 6.82, df = 5, p = .23).
| IUCN Red List category | All species (%) | Sharks (%) | Rays (%) | Chimaeras (%) |
|---|---|---|---|---|
| Critically Endangered | 12 (6.7) | 8 (7.8) | 4 (5.6) | 0 (0) |
| Endangered | 25 (13.9) | 15 (14.7) | 10 (13.9) | 0 (0) |
| Vulnerable | 27 (15) | 18 (17.6) | 9 (12.5) | 0 (0) |
| Near Threatened | 17 (9.4) | 11 (10.8) | 5 (6.9) | 1 (16.7) |
| Least Concern | 97 (53.9) | 48 (47.1) | 44 (61.1) | 5 (83.3) |
| Data Deficient | 2 (1.1) | 2 (2) | 0 (0) | 0 (0) |
| Total threatened | 64 (35.6) | 41 (40.2) | 23 (31.9) | 0 (0) |
Endemicity and risk
Of the 66 endemic species, 26 were sharks, 36 were rays, and 4 were chimaeras; most (82%; n = 54) were non-threatened deep- water species. The top three orders by number of endemic spe- cies were Rajiformes (n = 29), Carcharhiniformes (n = 15) and Squaliformes (n = 8). Two-thirds (66.6%; n = 4 of 6) of all chimaeras in the WCA were endemic. Nine (13.6%) endemic species had a decreasing population trend; 53 (80.3%) had a stable population trend; two (3%) had an increasing population trend; and two (3%) had an unknown population trend. Eighty-nine percent (n = 59 of 66) of endemic species were assessed as LC, and 4.5% (n = 3 of 66) were assessed as NT. No endemic species were assessed as DD. Among sharks, many (72%, n = 18 of 25) of the endemic, non-threatened species were lantern sharks (Etmopteridae) and deepwater catsharks (Pentanchidae and Scyliorhinidae). Among rays, many (75.8%, n = 25 of 33) were hardnose skates (Rajidae) and pygmy skates (Gurgesiellidae). No endemic chimaeras were in a threatened category, but one endemic shark and three endemic rays were: the Venezuelan Dwarf Smoothhound (Mustelus mini- canis, Triakidae; EN), Venezuelan Round Ray (Urotrygon venezuelae, Urotrygonidae; EN), Colombian Electric Ray (Diplobatis colombi- ensis, Narcinidae; VU) and Brownband Numbfish (Diplobatis gua- machensis, Narcinidae; VU).
The majority of near-endemic species were rays (64%, n = 9 of 14); the remainder were sharks (36%, n = 5 of 14). The or- ders with the most near-endemic species were Rajiformes (n = 4), Myliobatiformes (n = 3), Carcharhiniformes (n = 2) and Squaliformes (n = 2). Most (57%, n = 8 of 14) near-endemic species had a decreasing population trend; five (36%) had a stable pop- ulation trend; and one (7%) had an increasing population trend. No near-endemic sharks were in a threatened category, but three near-endemic rays were: the Painted Dwarf Numbfish (Diplobatis picta, Narcinidae; VU), Freckled Guitarfish (Pseudobatos lentigino- sus, Rhinobatidae; VU) and Atlantic Chupare (Styracura schmardae, Potamotrygonidae; EN).
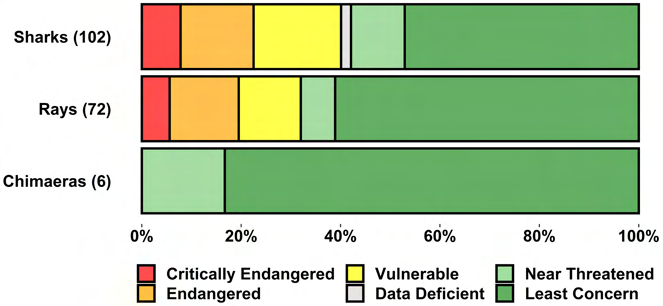
Figure 3. Percentage of sharks, rays and chimaeras found in the Western Central Atlantic Ocean in each IUCN Red List of Threatened Species category. The number of species in each group appears in parentheses
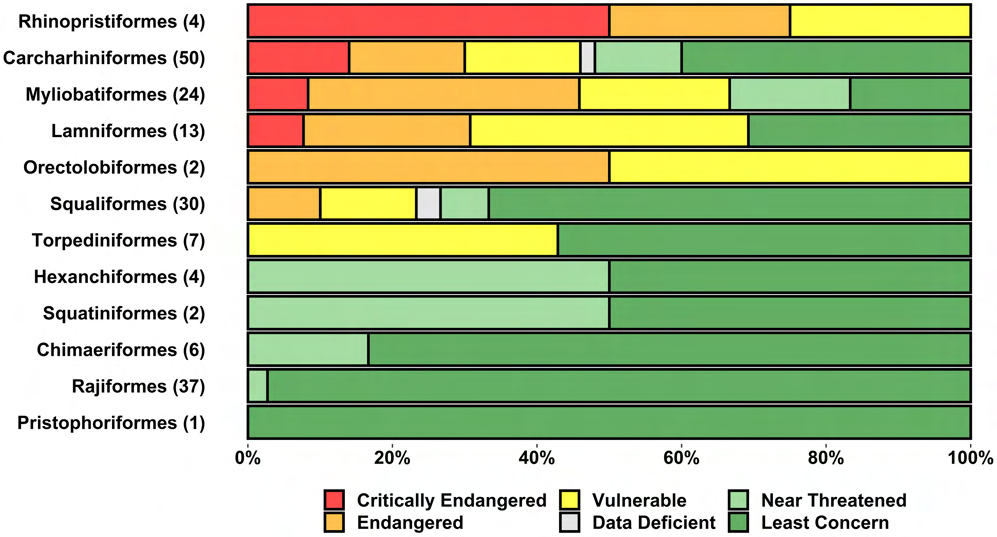
Figure 4. Percentage of each chondrichthyan order found in the Western Central Atlantic Ocean by IUCN Red List of Threatened Species category. The number of species in each order appears in parentheses Endemic and near-endemic species richness was highest on the continental shelf of North and South America, with hotspots around the Florida Straits, northern Gulf of Mexico and southern Caribbean Sea (Figure 2b). Threatened endemic and near-endemic species rich- ness was highest on parts of the continental shelf in Central and South America, particularly in Venezuela and Colombia (Figure 2c). Threatened endemic and near-endemic species occurred at depths ranging from 0 to 185 m.
Conservation responsibility
The five countries with the highest conservation responsibility (CoR) were the United States, Venezuela, Mexico, Guyana and The Bahamas (Figure 6). International waters had the third highest CoR of all jurisdictions (Table S2). Combined, these six jurisdictions ac- counted for 66.8% of all CoR in the region.
Key threats
‘Biological resource use’ and, more specifically, ‘fishing and har- vesting aquatic resources’ imperilled most sharks and rays (87.8%, n = 158 of 180). Threatened species were taken both incidentally and intentionally in large- and small-scale fisheries; all threatened species were captured incidentally (100%, n = 64 of 64), and most were captured intentionally (81%, n = 52 of 64; Figure 7). The threat of overfishing was compounded by habitat loss and degradation and climate change. Habitat loss and degradation imperilled one quar- ter (26.6%, n = 17 of 64) of threatened species, primarily through residential and commercial development (and associated habitat modifications), which affected 20.3% (n = 13 of 64) of species. Less common pathways to habitat loss and degradation were agriculture and aquaculture (6.3%, n = 4 of 64), energy production and mining (4.7%, n = 3 of 64), transportation and service corridors (4.7%, n = 3 of 64), human intrusions and disturbance (4.7%, n = 3 of 64), natural system modifications (e.g. dams; 1.6%, n = 1 of 64), and invasive and other problematic species (1.6%, n = 1 of 64). Climate change and severe weather imperilled 14.1% (n = 9 of 64) of threatened species. Lastly, pollution (particularly land-based) imperilled 6.3% (n = 4 of 64) of threatened species.
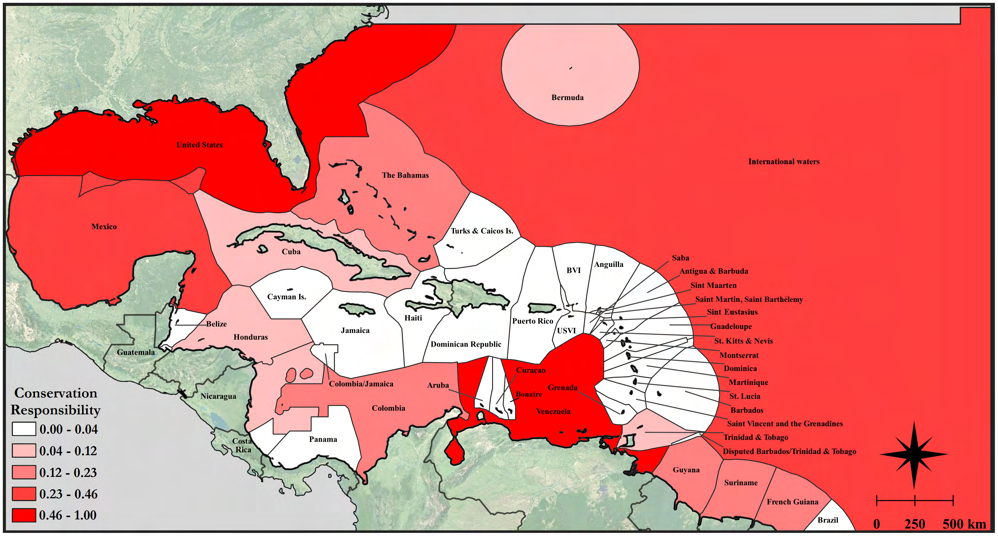
Figure 6. Map of chondrichthyan conservation responsibility for each jurisdiction in the Western Central Atlantic Ocean, where scores are normalized by the maximum score (attributed to the USA) to display from 0 to 1. National boundaries are dark grey (Claus et al., 2014). Areas outside of the Western Central Atlantic Ocean are shaded grey. BVI is British Virgin Islands, and USVI is U.S. Virgin Islands. Map base layer source: Esri® residential and commercial development (and associated habitat modifications), which affected 20.3% (n = 13 of 64) of species. Less common pathways to habitat loss and degradation were agriculture and aquaculture (6.3%, n = 4 of 64), energy production and mining (4.7%, n = 3 of 64), transportation and service corridors (4.7%, n = 3 of 64), human intrusions and disturbance (4.7%, n = 3 of 64), natural system modifications (e.g. dams; 1.6%, n = 1 of 64), and invasive and other problematic species (1.6%, n = 1 of 64). Climate change and severe weather imperilled 14.1% (n = 9 of 64) of threatened species. Lastly, pollution (particularly land-based) imperilled 6.3% (n = 4 of 64) of threatened species.
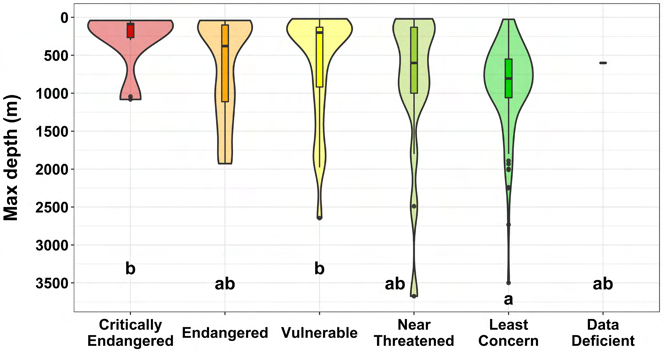
Figure 5. Violin plot of maximum depths of occurrence for all chondrichthyans found in the Western Central Atlantic Ocean by IUCN Red List of Threatened Species category. Each dot represents an outlier, horizontal black lines indicate the median, and boxes indicate the interquartile range. Letters represent results of Dunn's post hoc tests for differences in maximum depth between extinction risk categories, where those sharing the same letter are not significantly different
Reconstructed fisheries catches
Sharks
Reconstructed shark catches in the WCA more than tripled in 34 years from 1950 (19,458 metric tons; mt) to 1984 (63,815 mt), plateaued until 1997 (between 48,536 mt and 59,329 mt) and then halved over the next decade (2010: 24,015 mt; Figure 8a). In 2011, catches increased to 37,763 mt, due in part to a 451% increase in reported Venezuelan catches from 2010 to 2011. Spanish catches also rose dramatically between 2009 (0.39 mt) and 2012/2013 (5701 mt/9230 mt), mostly driven by catches of Blue Shark (Prionace glauca, Carcharhinidae; 14,318 mt; 96% of Spain's total shark catches during those 2 years). By 2014, catches by both countries declined to 24.9% of what they were in 2012. By 2016, the total reconstructed catch of sharks in the WCA was approximately half (47.4%) of the peak catch in 1984. Most shark catches in the region, as well as overall trends in catches, can largely be attributed to fishing by the United States, Venezuela, Mexico, Cuba, the Dominican Republic and Jamaica (Table 2). Cuba's maximum annual catch of 4562 mt occurred in 1977 during a period of elevated catches from 1968 to 2003, when the mean annual catch was 3295 mt (±801 SD). Outside of that period, in 1950–1967 and 2004–2016, the mean annual catch was 1323 mt (±343 SD). Jamaica's maximum annual catch peaked early in 1950 (3336 mt), and catches declined noticeably from 1978 (3160 mt) to 1994 (834 mt), then remained low around a mean annual catch of 1079 mt (±248 SD). In contrast, catches by the Dominican Republic increased four-fold from a low in 1950 (1079 mt) to a peak in 1993 (4390 mt), then remained high around a mean annual catch of 3277 mt (±247 SD) through the end of the time series. Foreign fleets were responsible for 2.1% (49,468 mt) of all shark catches. Shark catches by small-scale gillnets (457,495 mt), small-scale longlines (358,607 mt) and miscellaneous subsistence fishing gear (362,685 mt) comprised 49% (1,178,787 mt) of total shark catches (2,404,751 mt). Another 24% (586,132 mt) of catches were attributed to shrimp trawls (279,395 mt) and small-scale lines (306,737 mt). Taxonomic resolution of shark-specific catches was poor; 51.9% of all shark catches were listed only as ‘Elasmobranchii’ or ‘Chondrichthyes’. Much (17.7%, 426,597 mt) of the regional shark catch from 1950 to 2016 was requiem shark (listed as ‘Carcharhinidae’ or ‘Carcharhinus’). Among all recorded shark species, Atlantic Sharpnose Shark (Rhizoprionodon terraenovae, Carcharhinidae) made up the largest percentage of catches at 4.5% (109,109 mt), followed by Atlantic Nurse Shark (Ginglymostoma cirratum, Ginglymostomatidae; 3.9%, 92,942 mt), Tiger Shark (Galeocerdo cuvier, Galeocerdidae; 3.1%, 73,567 mt), Blacktip Shark (Carcharhinus limbatus, Carcharhinidae; 2.6%, 62,075 mt), Blue Shark (2.1%, 50,505 mt), Bonnethead Shark (Sphyrna tiburo, Sphyrnidae; 2.0%, 49,256 mt) and Shortfin Mako (Isurus oxyrinchus, Lamnidae; 2.0%, 48,690 mt). Every other spe- cies made up less than 2% of the total catches, although catches of some may have been greater but were absorbed into higher tax- onomic groupings.
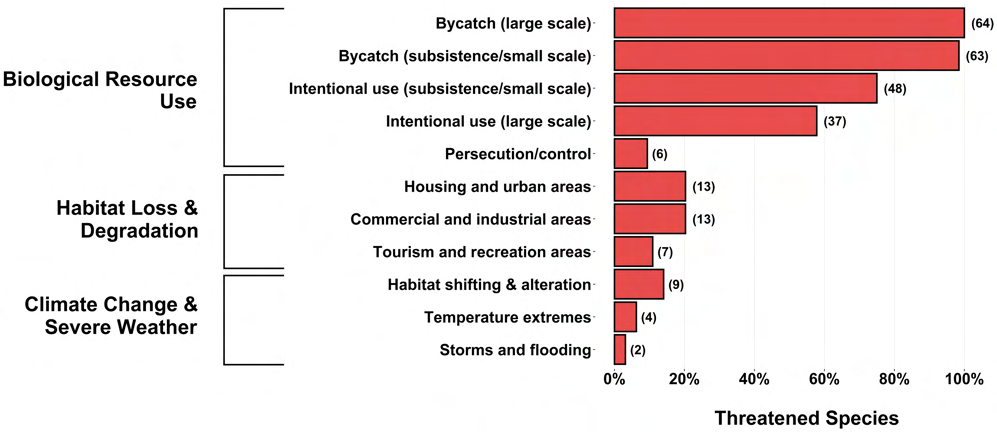
Figure 7. Count and percentage of threatened chondrichthyans (n = 64) in the Western Central Atlantic Ocean imperilled by the most common threats listed in IUCN Red List assessments. The number of species imperilled by each threat appears in parentheses (5701 mt/9230 mt), mostly driven by catches of Blue Shark (Prionace glauca, Carcharhinidae; 14,318 mt; 96% of Spain's total shark catches during those 2 years). By 2014, catches by both countries declined to 24.9% of what they were in 2012. By 2016, the total reconstructed catch of sharks in the WCA was approximately half (47.4%) of the peak catch in 1984. Most shark catches in the region, as well as overall trends in catches, can largely be attributed to fishing by the United States, Venezuela, Mexico, Cuba, the Dominican Republic and Jamaica (Table 2). Cuba's maximum annual catch of 4562 mt occurred in 1977 during a period of elevated catches from 1968 to 2003, when the mean annual catch was 3295 mt (±801 SD). Outside of that period, in 1950–1967 and 2004–2016, the mean annual catch was 1323 mt (±343 SD). Jamaica's maximum annual catch peaked early in 1950 (3336 mt), and catches declined noticeably from 1978 (3160 mt) to 1994 (834 mt), then remained low around a mean annual catch of 1079 mt (±248 SD). In contrast, catches by the Dominican Republic increased four-fold from a low in 1950 (1079 mt) to a peak in 1993 (4390 mt), then remained high around a mean annual catch of 3277 mt (±247 SD) through the end of the time series. Foreign fleets were responsible for 2.1% (49,468 mt) of all shark catches. Shark catches by small-scale gillnets (457,495 mt), small-scale longlines (358,607 mt) and miscellaneous subsistence fishing gear (362,685 mt) comprised 49% (1,178,787 mt) of total shark catches (2,404,751 mt). Another 24% (586,132 mt) of catches were attributed to shrimp trawls (279,395 mt) and small-scale lines (306,737 mt). Taxonomic resolution of shark-specific catches was poor; 51.9% of all shark catches were listed only as ‘Elasmobranchii’ or ‘Chondrichthyes’. Much (17.7%, 426,597 mt) of the regional shark catch from 1950 to 2016 was requiem shark (listed as ‘Carcharhinidae’ or ‘Carcharhinus’). Among all recorded shark species, Atlantic Sharpnose Shark (Rhizoprionodon terraenovae, Carcharhinidae) made up the largest percentage of catches at 4.5% (109,109 mt), followed by Atlantic Nurse Shark (Ginglymostoma cirratum, Ginglymostomatidae; 3.9%, 92,942 mt), Tiger Shark (Galeocerdo cuvier, Galeocerdidae; 3.1%, 73,567 mt), Blacktip Shark (Carcharhinus limbatus, Carcharhinidae; 2.6%, 62,075 mt), Blue Shark (2.1%, 50,505 mt), Bonnethead Shark (Sphyrna tiburo, Sphyrnidae; 2.0%, 49,256 mt) and Shortfin Mako (Isurus oxyrinchus, Lamnidae; 2.0%, 48,690 mt). Every other spe- cies made up less than 2% of the total catches, although catches of some may have been greater but were absorbed into higher tax- onomic groupings.
Rays
Reconstructed ray catches increased by an order of magnitude from 1950 (2076 mt) to the peak in 1992 (22,587 mt), then fluc- tuated between that and a low of 10,892 mt until the end of the series (Figure 8b). Venezuela, Mexico and the United States were responsible for the largest catches of rays (Table 2). Cuba's catches increased in the 1990s to contribute substantially to re- gional catches by 1997 (although national landings data show this increase occurring a decade earlier; PAN-Tiburones, 2015). Catches of rays in the United States were unusually high in 1992 (9477 mt; 94% of which were stingrays [Dasyatidae]); otherwise, they ranged between 408 mt and 2130 mt. Foreign fleets were responsible for 6.5% (36,758 mt) of all ray catches. Among all gear types, bottom trawls (142,159 mt) and gillnets (including trammel nets; 306,570 mt) were responsible for most (78.9%; 448,730 mt) ray catches. As with sharks, taxonomic resolution among recorded ray catches was poor; two-thirds (69%) of all rays were listed as only ‘Batoidea’ or ‘Rajiformes’. The Chola Guitarfish (reported as Rhinobatos percellens, now Pseudobatos percellens, Rhinobatidae) was caught more than any other listed ray species (73,800 mt, 13% of rays) and is EN.
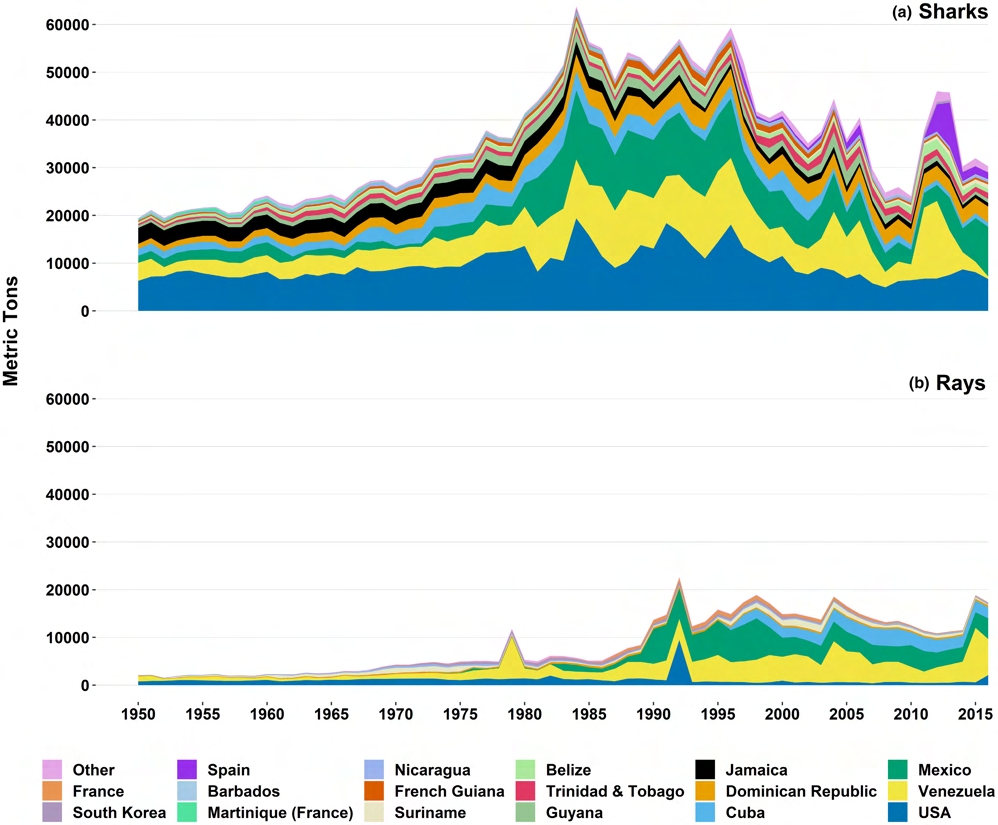
Figure 8. Reconstructed catches of (a) sharks and (b) rays in the Western Central Atlantic Ocean from 1950 to 2016 by country. Countries with <10,000 metric tons of cumulative shark and ray catches across all years are grouped as ‘Other’. Catch data are from Sea Around Us (Pauly et al., 2020) only ‘Batoidea’ or ‘Rajiformes’. The Chola Guitarfish (reported as Rhinobatos percellens, now Pseudobatos percellens, Rhinobatidae) was caught more than any other listed ray species (73,800 mt, 13% of rays) and is EN.
Management
Some shark and ray species (13.9%, n = 25 of 180) were listed on an Appendix or Annex of CITES, CMS, and/or SPAW. Twenty species were listed on CITES (Appendix I: two species; Appendix II: 18 spe- cies; Table S1), all of which were also listed on CMS (Appendix I only: one species; Appendix II only: nine species; Appendix I and II: 10 species). Nine species were listed on SPAW (Annex II: two species; Annex III: seven species), all of which were also listed on CITES and CMS. Three species were listed on only CMS in Appendix II: Dusky Shark (Carcharhinus obscurus, Carcharhinidae; EN), Blue Shark (NT) and Spiny Dogfish (Squalus acanthias, Squalidae; VU).
Stock assessments were conducted for the Gulf of Mexico, Atlantic, North Atlantic, or Northwest Atlantic populations of 42 (23.3%, n = 42 of 180) shark and ray species that occur in the WCA. Six (14.3%, n = 6 of 42) stocks were overfished and eight (19.1%, n = 8 of 42) were not overfished (Table S1). Overfishing was occur- ring in four (9.5%, n = 4 of 42) stocks and not occurring in ten (23.8%, n = 10 of 42). Twenty-eight (66.7%, n = 28 of 42) stocks were as- signed an overfished/overfishing status of ‘unknown’.
The type and degree of shark and ray management varied in the WCA (Table 3; see Table S3 for full details and references). Many countries were party to some international agreements, but not others, resulting in a complex matrix of obligations and regulations that in some cases varied even at the island level (e.g. Kingdom of the Netherlands). Of all international management mechanisms, WECAFC had the highest participation (100%), which meant that all countries were also covered by its RPOA–IUU and will be covered by its RPOA–Sharks once it is finalized. Participation in CITES was also high (97.8%); only Haiti was a non-party. The PSM, a binding agreement that combats IUU fishing, had low participation (44.4%), as did CMS Sharks MoU (42.2%). Eleven countries prohibited either commercial or all fishing of sharks (n = 10) or rays (n = 9), although Honduras' prohibition on shark fishing included a notable exception for the retention and sale of incidentally caught sharks. The four regional leaders in Management Engagement (ME) were all French overseas jurisdictions (Figure 9). Despite trailing those countries in ME, the United States had the most detailed fisheries management framework (much of which was included in ‘other reg- ulations’) that included species-specific catch quotas, time-area clo- sures, gear restrictions, size restrictions and more (Table S3). Twelve countries had less than 50% ME (Figure 10a); Haiti, for example, had only an RPOA–IUU. Suriname, Guyana and Jamaica had noticeably low ME despite having either high CoR (Suriname and Guyana) or high historical reconstructed catches (Jamaica; Figure 10b). Mexico and Venezuela also had relatively low ME (53.9% and 61.5%, re- spectively) despite having both high CoR and high historical recon- structed catches. There was no relationship between ME and either total reconstructed catch or CoR. However, there was a positive relationship between CoR and total reconstructed catch (p < .05, ad- justed r2 = 0.74).
Table 2. Total reconstructed catch of sharks and rays in the Western Central Atlantic Ocean (WCA; FAO Major Fishing Area 31) from 1950 to 2016 by country
| Country | Shark catch (mt) | Ray catch (mt) | Shark and ray catch (mt) |
|---|---|---|---|
| WCA fleets | |||
| United States of America | 646,031 | 74,292 | 720,323 |
| Venezuela | 467,135 | 192,310 | 659,445 |
| Mexico | 387,410 | 141,355 | 528,765 |
| Cuba | 159,636 | 52,724 | 212,360 |
| Dominican Republic | 177,517 | 17,894 | 195,411 |
| Jamaica | 144,568 | 144,568 | |
| Guyana | 92,368 | 92,368 | |
| Trinidad and Tobago | 69,138 | 1051 | 70,189 |
| Belize | 62,514 | 62,514 | |
| Suriname | 17,562 | 34,473 | 52,035 |
| French Guiana | 49,564 | 265 | 49,829 |
| Nicaragua | 31,093 | 16,049 | 47,142 |
| Martinique (France) | 11,603 | 44 | 11,647 |
| Barbados | 10,665 | 10,665 | |
| Colombia | 9278 | 9278 | |
| Costa Rica | 4544 | 4544 | |
| Turks and Caicos Isl. (UK) | 2180 | 2180 | |
| Antigua and Barbuda | 1565 | 1565 | |
| Grenada | 1479 | 1479 | |
| Panama | 1201 | 1201 | |
| Saint Martin (France) | 1178 | 1178 | |
| Honduras | 1168 | 1168 | |
| Saint Vincent and the Grenadines | 1083 | 10 | 1093 |
| Guatemala | 872 | 872 | |
| Guadeloupe (France) | 701 | 96 | 797 |
| Saint Barthelemy (France) | 723 | 723 | |
| Bahamas | 720 | 720 | |
| Curaçao | 664 | 664 | |
| Saint Lucia | 522 | 59 | 581 |
| Cayman Isl. (UK) | 485 | 485 | |
| Bermuda (UK) | 438 | 438 | |
| Aruba (Netherlands) | 301 | 301 | |
| Bonaire (Netherlands) | 279 | 279 | |
| Dominica | 129 | 0 | 129 |
| Montserrat (UK) | 63 | 0 | 63 |
| Haiti | 15 | 39 | 55 |
| British Virgin Isl. (UK) | 37 | 37 | |
| Brazil | 26 | 26 | |
| Anguilla (UK) | 12 | 12 | |
| Saba and St. Eustatius (Netherlands) | |||
| Saint Kitts and Nevis | |||
| U.S. Virgin Islands (USA) | |||
| Puerto Rico (USA) | |||
| Foreign fleets | |||
| Spain | 28,405 | 28,405 | |
| South Korea | 4079 | 14,561 | 18,640 |
| France | 16,363 | 16,363 | |
| Japan | 1972 | 5834 | 7807 |
| Unknown Fishing Country | 7746 | 7746 | |
| Taiwan | 6320 | 6320 | |
| Portugal | 673 | 673 | |
| China | 111 | 111 | |
| Vanuatu | 75 | 75 | |
| Canada | 64 | 64 | |
| Netherlands | 22 | 22 | |
| Philippines | 0.2 | 0.2 | |
| Denmark | 0.1 | 0.1 | |
| Sweden | 0.0001 | 0.0001 | |
| Total | 2,404,751 | 568,603 | 2,973,354 |
DISCUSSION
We provide the first comprehensive reassessment of extinction risk for sharks and rays that occur in the WCA and find this region to be a microcosm of the global challenge to their conservation. Thirty-six percent of sharks and rays in the WCA are threatened with an elevated risk of extinction, which is similar to the percent- age of sharks and rays threatened globally (Dulvy, Pacoureau, et al., 2021). An even larger proportion—nearly half of all sharks and rays in the WCA (48.9%)—exhibit a decreasing population trend across their global range. Overfishing is the overwhelming threat to their populations and has driven declines in all threat- ened species. The United States, Venezuela and Mexico over- shadow all other countries in the WCA in terms of conservation responsibility and total reconstructed catches of sharks and rays. However, the United States likely has the strongest fisheries man- agement in the region and stands out as one of few countries with sustainable shark fishing (Simpfendorfer & Dulvy, 2017). National- level regulations and engagement with international management mechanisms vary widely. In light of these findings, we consider patterns in species richness and extinction risk, highlight species of concern, discuss trends in fisheries and identify opportunities for improved management.
Species diversity
The WCA is a hotspot of shark and ray biodiversity (Carpenter, 2002; Weigmann, 2016), particularly for endemic (Derrick et al., 2020), ev- olutionarily distinct (Stein et al., 2018) and deepwater species (e.g. skates; Dulvy, Pacoureau, et al., 2021; McEachran & Miyake, 1990). It is comparable to temperate areas with high richness such as the Northeast Atlantic and Southeast Pacific Ocean, but, like coral reef diversity, this WCA fauna is only around half as rich as the fauna of the speciose Indo-West Pacific region (Weigmann, 2016). Species richness in the WCA is highest on the continental shelf (Carrillo- Briceño et al., 2018), with notably high species richness in large areas of U.S. waters (e.g. along the productive shelf in the Gulf of Mexico) and off the northern coast of South America, particularly at the dynamic boundary between the tropics and subtropics (Dulvy et al., 2014; Dulvy, Pacoureau, et al., 2021; Ward-Paige et al., 2010).
Table 3. Country-level management information, where NPOA–Sharks is a National Plan of Action for the Conservation and Management of Sharks; RPOA–Sharks is a Regional Plan of Action for the Conservation and Management of Sharks; other regulations include time/area closures, a ban on exports of shark or ray products, species-specific measures or gear restrictions relevant to chondrichthyans; NPOA–IUU is a National Plan of Action to Prevent, Deter and Eliminate Illegal, Unreported and Unregulated (IUU) Fishing; RPOA–IUU is a Regional Plan of Action to Prevent, Deter and Eliminate IUU Fishing; PSM is the Agreement on Port State Measures; WECAFC is the Western Central Atlantic Fishery Commission; CITES is the Convention on International Trade in Endangered Species of Wild Fauna and Flora; ICCAT is the International Commission for the Conservation of Atlantic Tunas; CMS is the Convention on the Conservation of Migratory Species of Wild Animals; CMS Sharks MoU is the Memorandum of Understanding on the Conservation of Migratory Sharks; and SPAW is the Convention for the Protection and Development of the Marine Environment of the Wider Caribbean Region Specially Protected Areas and Wildlife Protocol Country Shark fishing ban Ray fishing ban Finning ban NPOA– or RPOA–Sharksa Other regulations NPOA– or RPOA–IUU PSM WECAFCb CITESc ICCATd CMSe CMS Sharks MoUf SPAWg Bermuda No No Yes No No RPOA No Yes Yes Yes Yes Yes N/A Belize No Yes Yes NPOAh, RPOA Yes NPOA, RPOA No Yes Yes Yes No No Yes Bonaire Yes Yes Yes No Yes RPOA No Yes Yes No Yes Yes Yes Anguilla No No No No No RPOA No Yes Yes Yes No No Yes Aruba No No No No No RPOA No Yes Yes No No No Yes Bahamas Yes No Yes No Yes RPOA Yes Yes Yes No No No Yes Barbados No No No No No RPOA Yes Yes Yes Yes No No Yes Brazil No No Yes NPOA Yes RPOA No Yes Yes Yes Yes Yes No British Virgin Islands Yes Yes Yes No Yes RPOA No Yes Yes Yes Yes Yes No Cayman Islands Yes Yes Yes No No RPOA No Yes Yes Yes Yes Yes No Antigua & Barbuda No No Yes NPOA Yes NPOA, RPOA No Yes Yes No Yes No No (Continues) Grenada No No No No No RPOA Yes Yes Yes Yes No No Yes Guadeloupe No No Yes RPOA Yes RPOA Yes Yes Yes Yes Yes Yes Yes Guyana No No Yes No No RPOA Yes Yes Yes Coop. No No Yes Colombia Yes Yes Yes NPOA Yes RPOA No Yes Yes No No Yes Yes Dominican Republic Yes Yes Yes No Yes RPOA No Yes Yes No Yes No Yes French Guiana No No Yes RPOA Yes RPOA Yes Yes Yes Yes Yes Yes Yes Cuba No No Yes NPOA Yes RPOA Yes Yes Yes No Yes No Yes Curaçao No No No No No RPOA No Yes Yes Yes Yes No Yes Honduras Yesi No Yes RPOA Yes RPOA No Yes Yes Yes Yes No Yes Martinique No No Yes RPOA Yes RPOA Yes Yes Yes Yes Yes Yes Yes Guatemala No No Yes NPOA, RPOA Yes RPOA No Yes Yes Yes No No No Haiti No No No No No RPOA No Yes No No No No No Dominica No No No No No RPOA Yes Yes Yes No No No No Costa Rica No No Yes NPOA, RPOA Yes RPOA Yes Yes Yes Coop. Yes Yes No Mexico No No Yes NPOA Yes RPOA No Yes Yes Yes No No No Jamaica No No No No No RPOA No Yes Yes No Sig. No No
Note: Table 3 (country-level management information) is reproduced here as the two pages of the original article, since it does not fit as a text table.
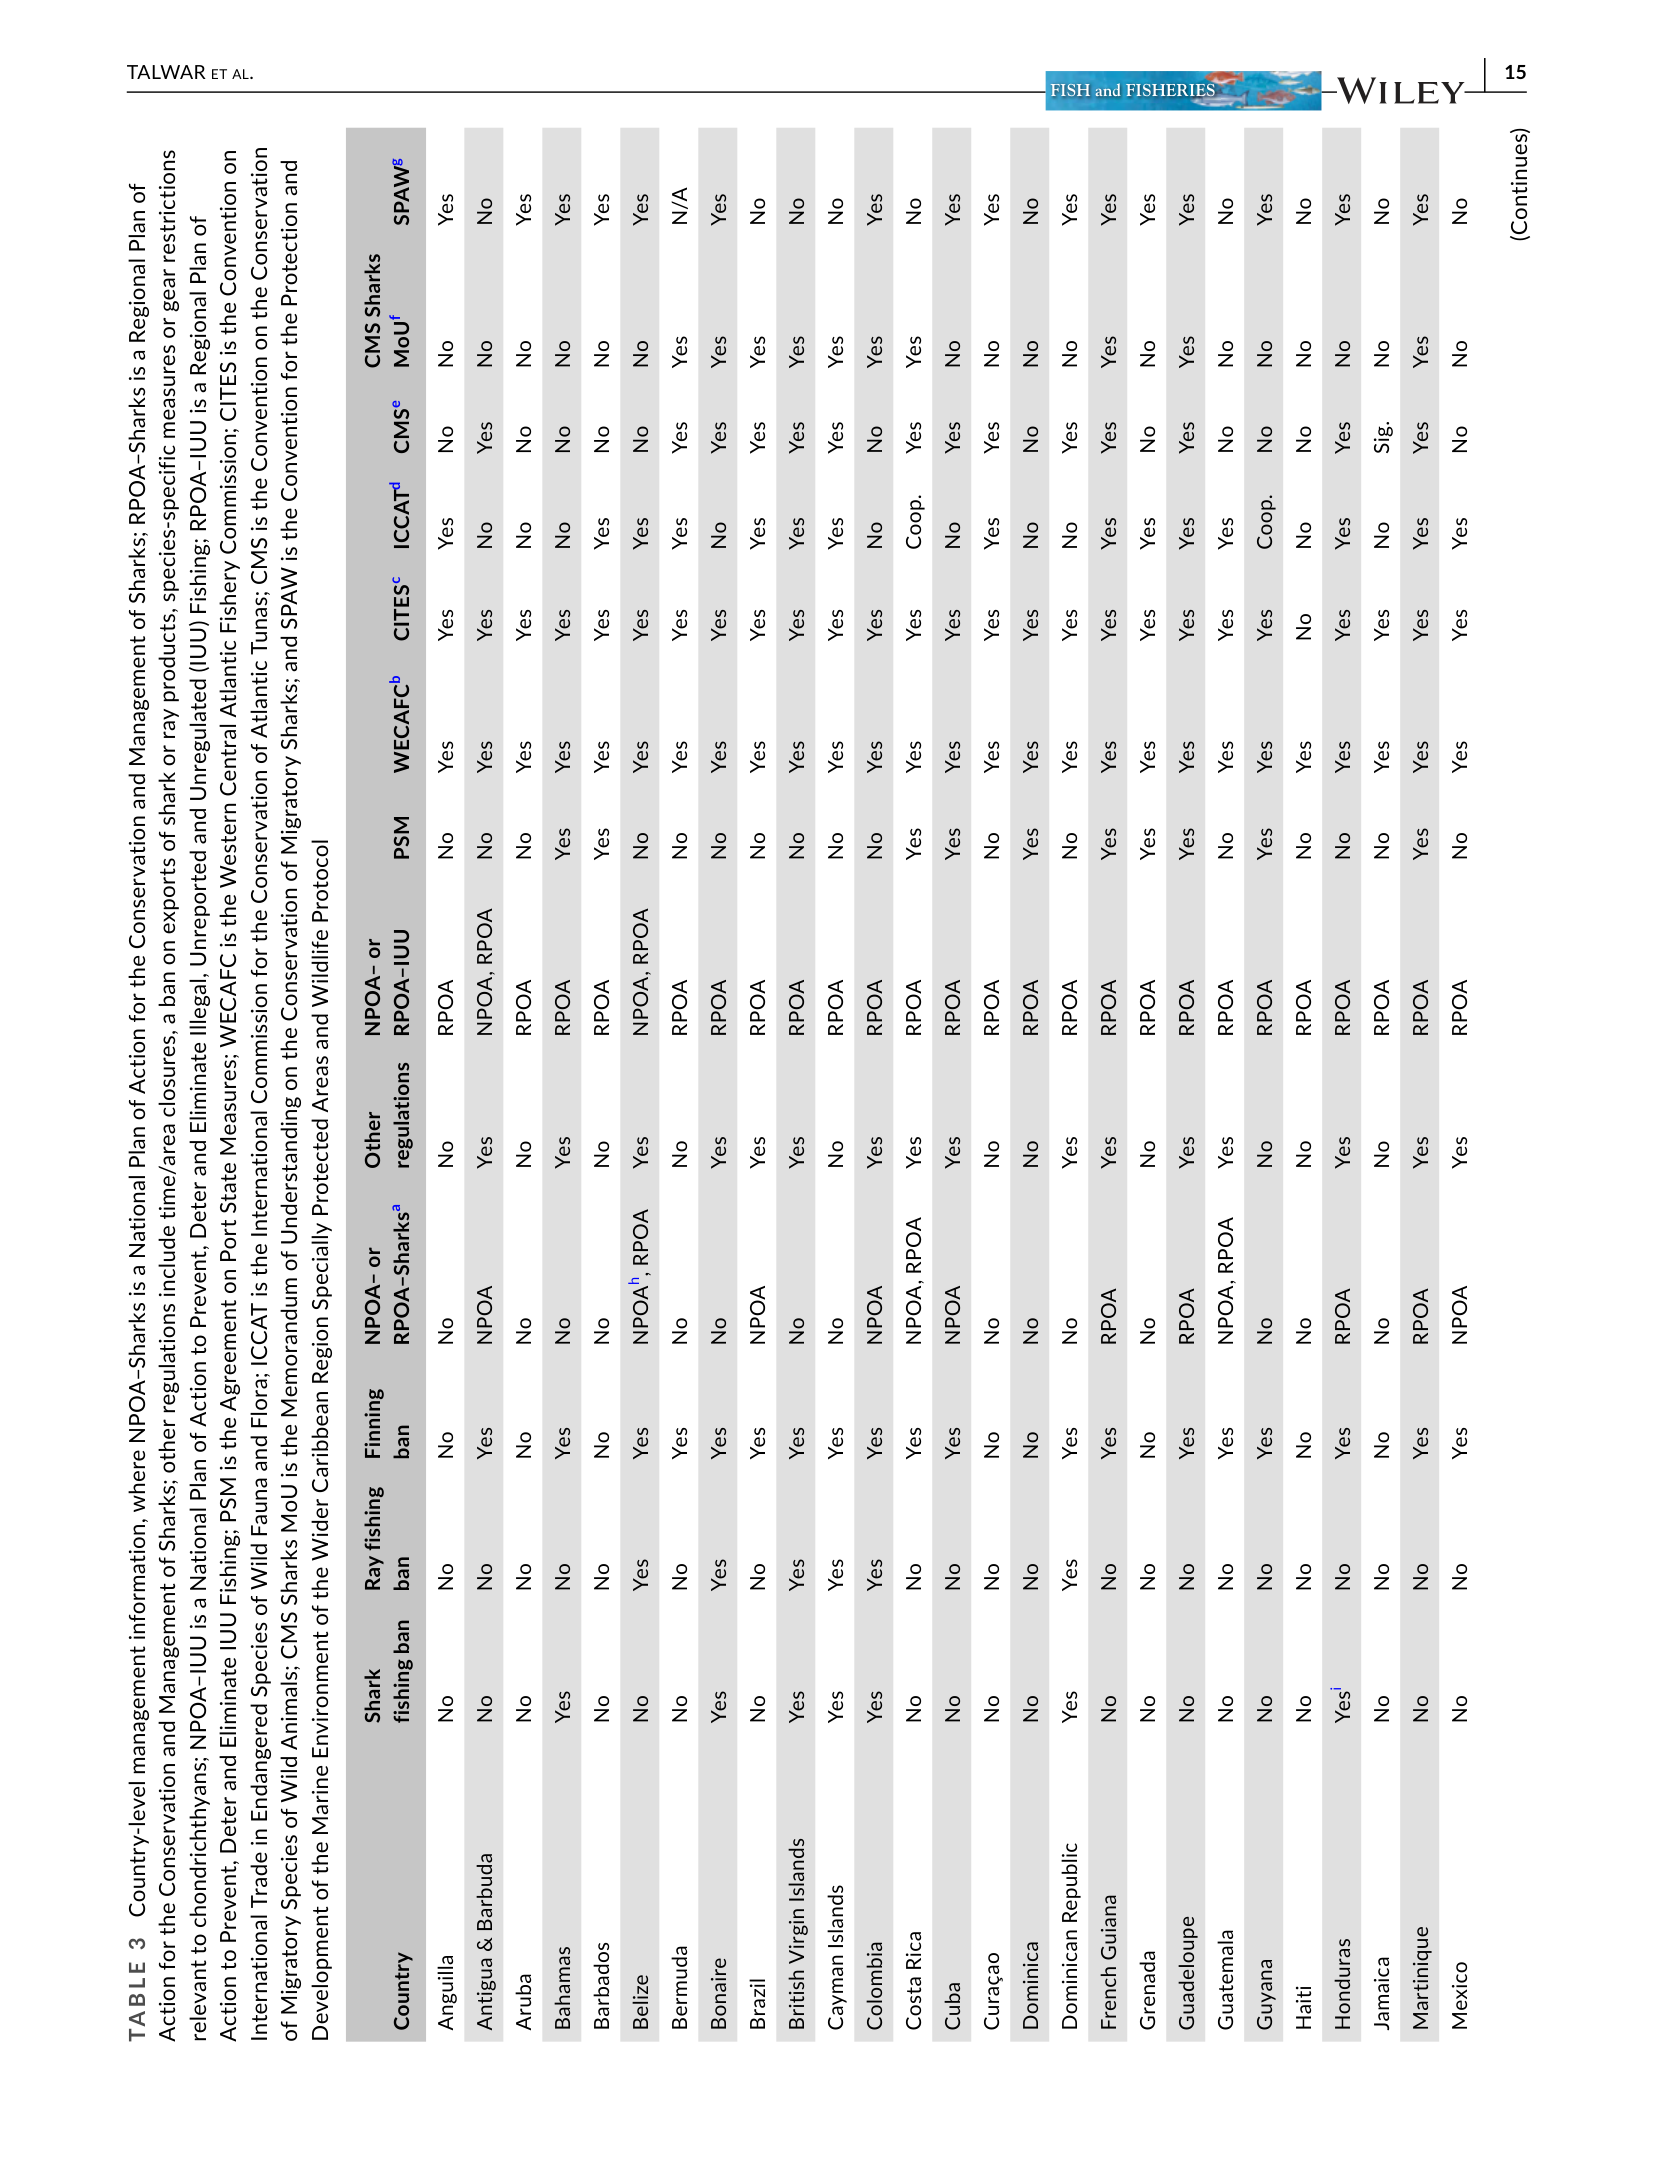
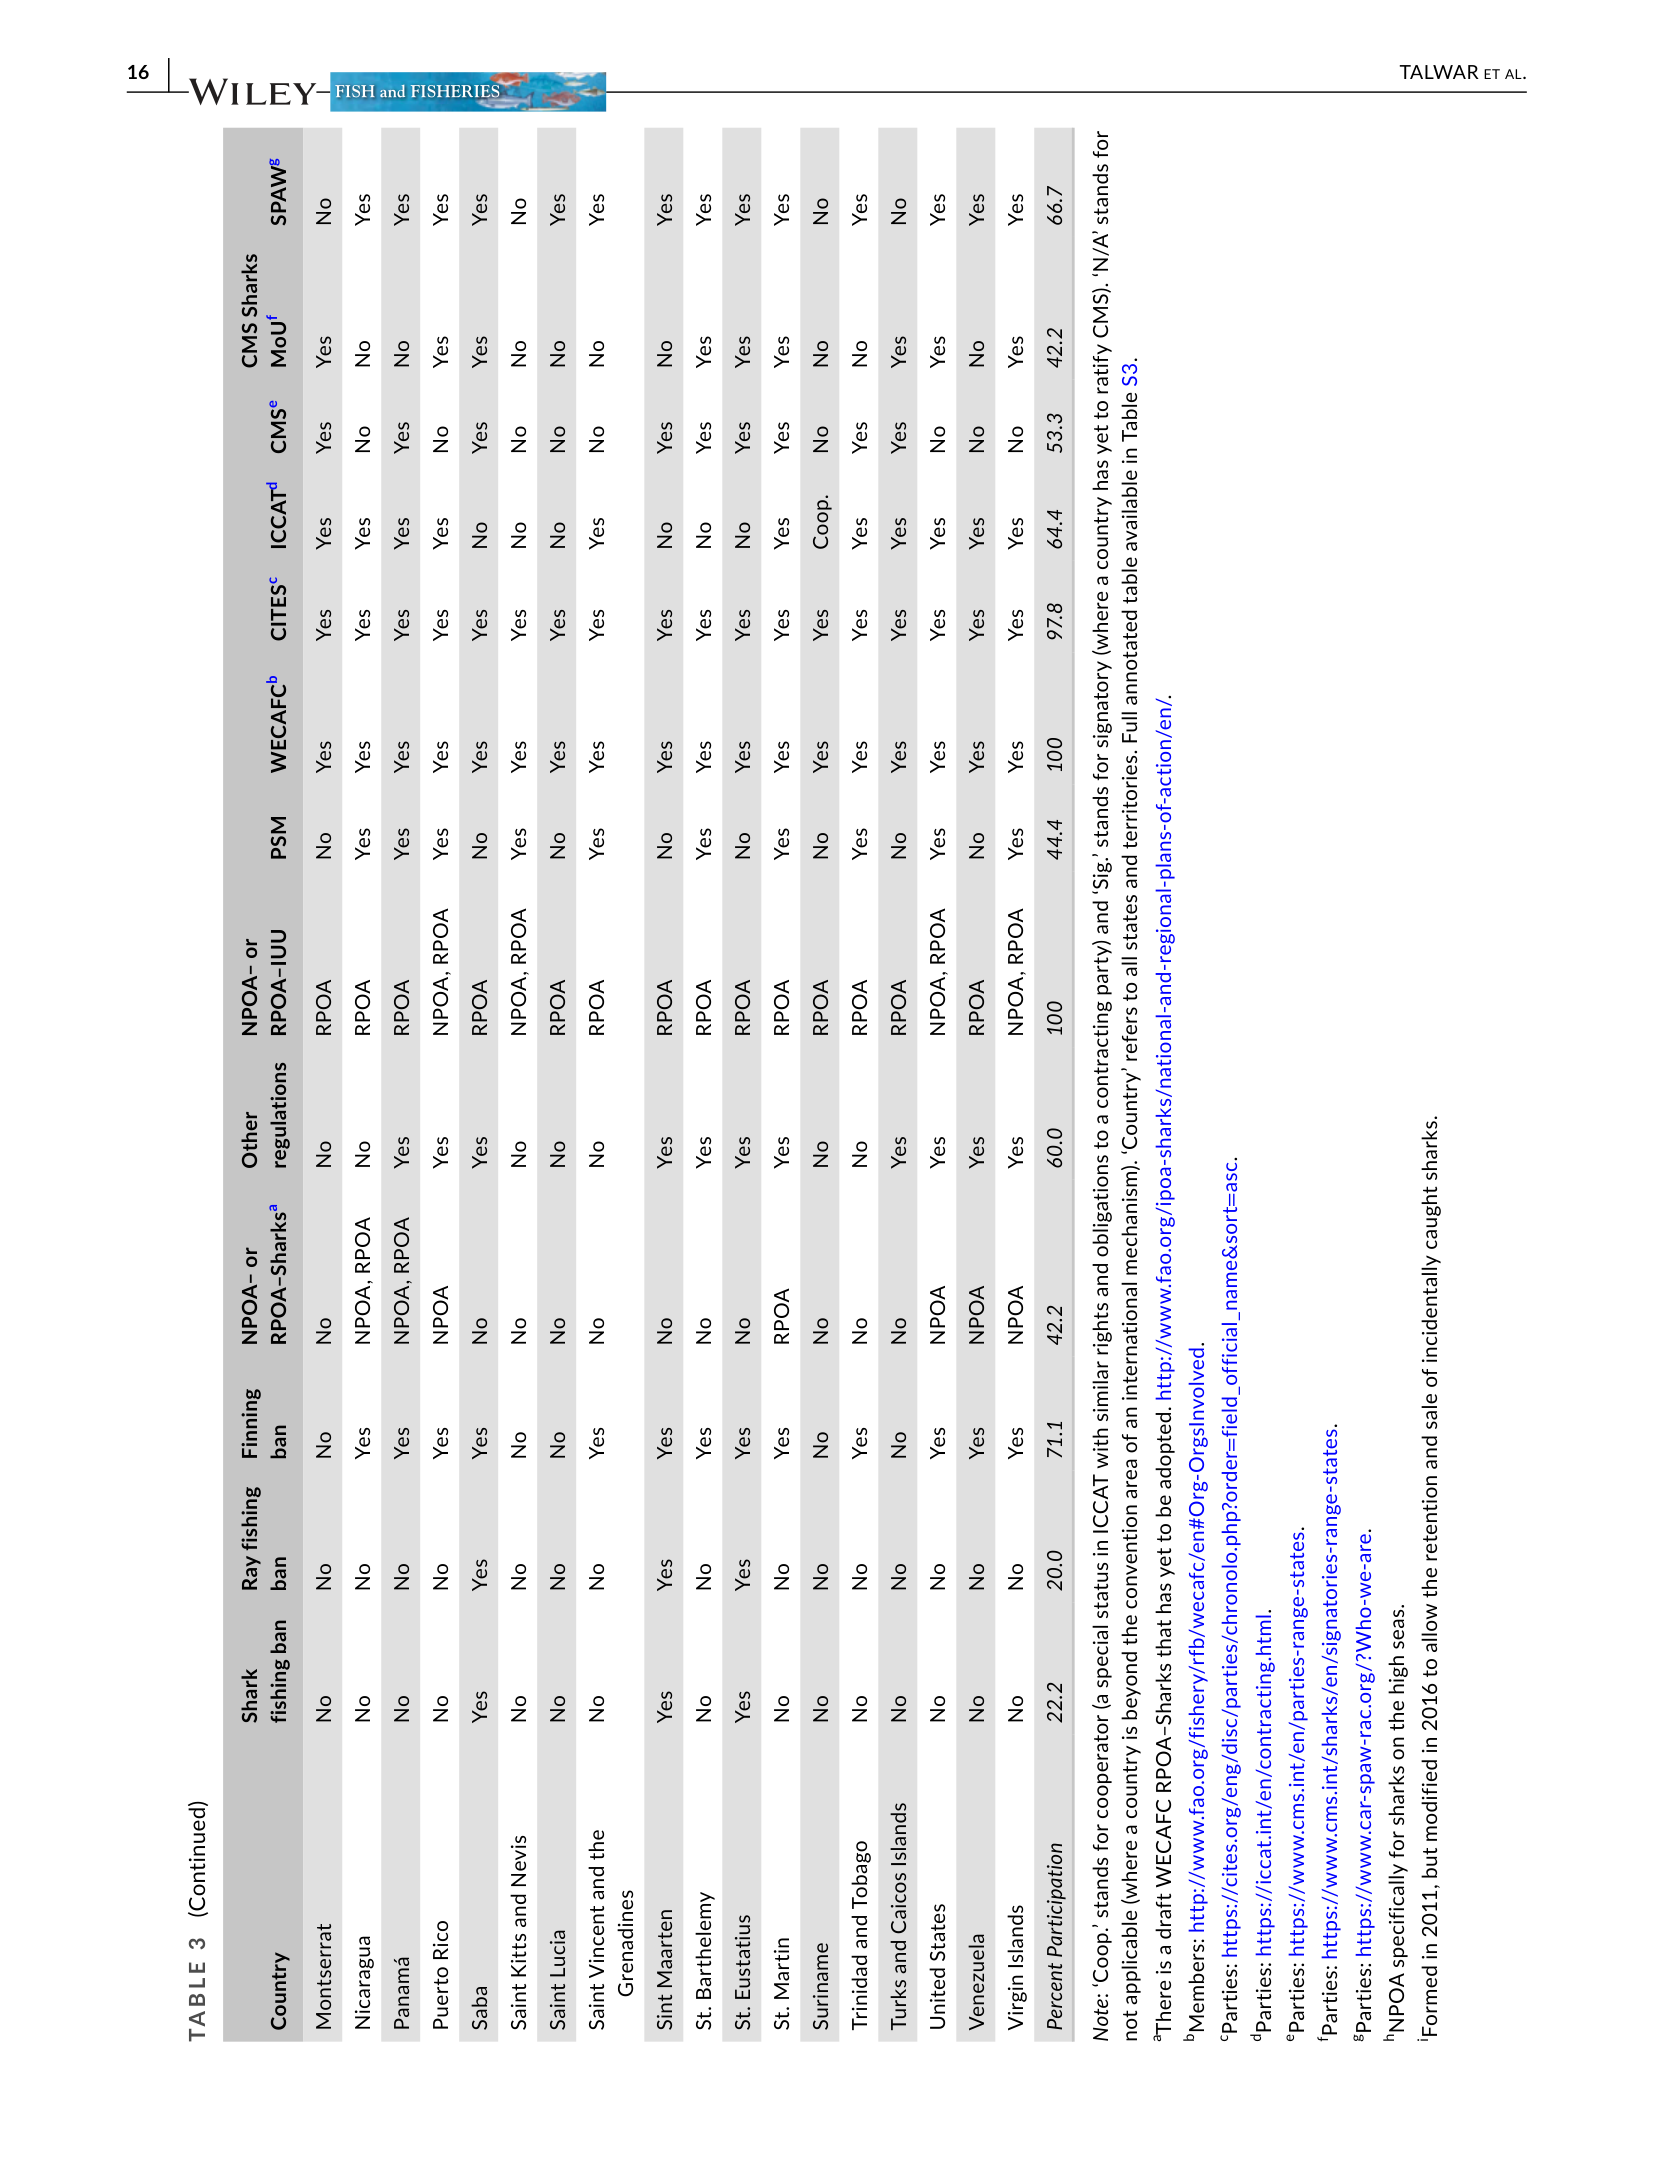
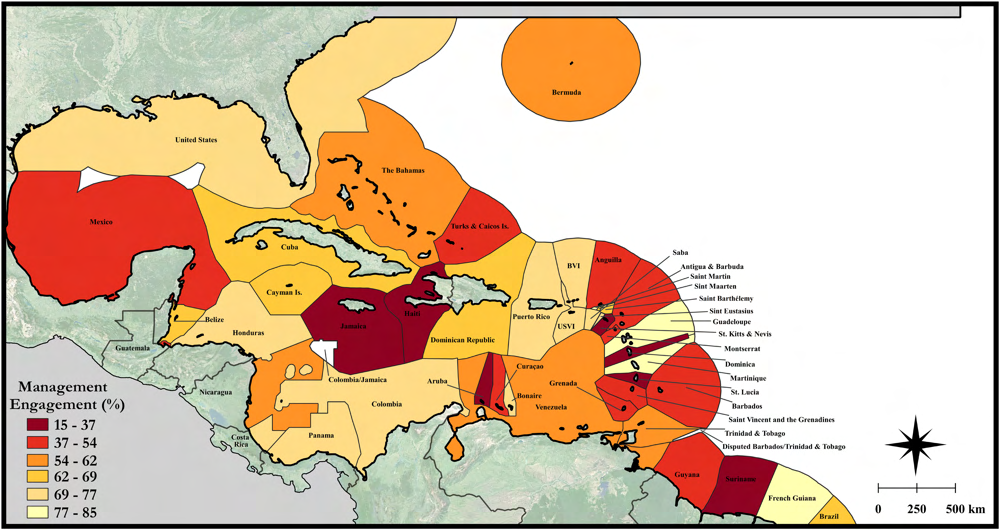
Figure 9. Map of management engagement (%) with 13 shark and ray management tools (assigned present or absent) for each country in the Western Central Atlantic Ocean. National boundaries are dark grey (Claus et al., 2014). Areas outside of the Western Central Atlantic Ocean are shaded grey. BVI is British Virgin Islands, and USVI is U.S. Virgin Islands. Map base layer source: Esri®
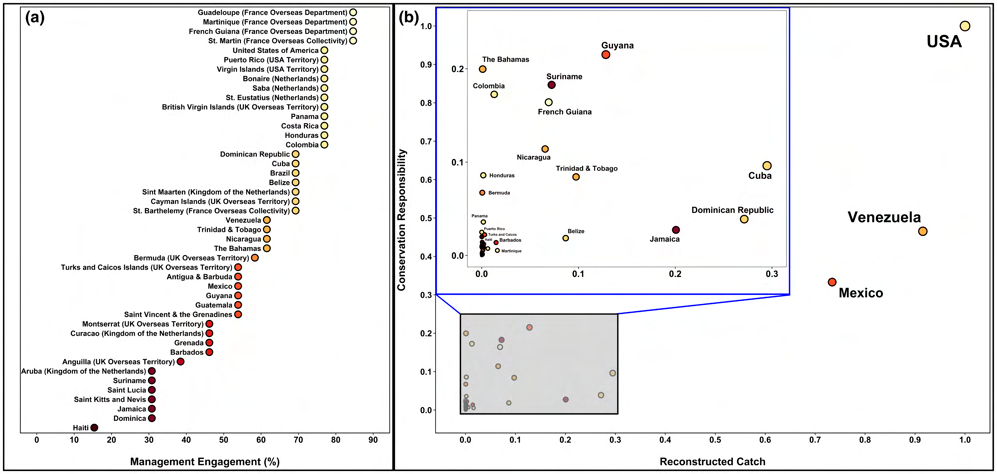
Figure 10. (a) Management engagement with 13 shark and ray management tools and (b) conservation responsibility and total reconstructed catches of sharks and rays in the Western Central Atlantic Ocean from 1950 to 2016, where each is normalized by the maximum score (attributed to the USA) to display from 0 to 1 Longline fishery data suggest high species richness of oceanic sharks along Venezuela's islands and coast as well as the Guyana shelf, par- ticularly where seasonal upwelling occurs and freshwater from the Orinoco River and Guyanese river drainages meets the Caribbean Sea (Castellanos et al., 2002; Cervigón, 2005; Muller-Karger & Varela, 1990; Tavares & Arocha, 2008). Similarly, marine bony fishes exhibit high species richness along continental Venezuela and Colombia, which could be driven by these same patterns and en- hanced by rocky coastlines (Cervigón, 2005; Linardich et al., 2019; Robertson & Cramer, 2014).
We caution that species distributions are best understood in regions with extensive sampling, but are still imperfectly known; U.S. waters, for example, exhibit high species richness and simulta- neously receive substantial research effort and funding (Linardich et al., 2019; Miloslavich et al., 2010; Robertson & Cramer, 2014). Elsewhere, data gaps are more common, and distributions are par- ticularly challenging to assign to countries in the southern and east- ern Caribbean Sea. Deepwater species distributions are data-poor, and records are sometimes limited to a single specimen, which often reflects a lack of deep-sea fisheries and research (e.g. American Pocket Shark [Mollisquama mississippiensis, Dalatiidae], Kyne & Herman, 2020a; Campeche Catshark [Parmaturus campechiensis, Pentanchidae], Kyne & Herman, 2020b).
Extinction risk
Spatial and temporal comparisons
The proportion of threatened sharks and rays in the WCA is higher today (35.6%) than it was in 2012 (18.5%; Kyne et al., 2012), but is similar to the recent global re-estimate (32.6%–45.5%; Dulvy, Pacoureau, et al., 2021). This change is largely due to new informa- tion and methodology (e.g. JARA; Sherley et al., 2020) being incor- porated into species assessments. Only three species had a genuine change (i.e. a real change in the rate of decline, population size, range size or habitat quality) in IUCN Red List Category since their last as- sessment, where the status of all three worsened: Blacknose Shark (Carcharhinus acronotus, Carcharhinidae; previously NT, now EN), Night Shark (Carcharhinus signatus, Carcharhinidae; previously VU, now EN), and Whale Shark (Rhincodon typus, Rhincodontidae; previ- ously VU, now EN). None of these three species are endemic to the WCA, although much of the Blacknose Shark's range is in this region.
Globally, most threatened sharks and rays occur in coastal shelf waters, particularly in the tropics (Dulvy, Pacoureau, et al., 2021); we found the same trend for the subset of WCA species, where CR and VU species occurred significantly shallower than LC species. As such, the bulk of Conservation Responsibility (CoR) fell on countries with the largest EEZs that included the most coastal, shelf-associated hab- itats (e.g. the United States, Venezuela and Mexico). Unfortunately, many sharks and rays that depend on nearshore habitats during critical life stages face myriad threats associated with being in close proximity to human population centres (Stallings, 2009; Ward-Paige et al., 2010), including fishing (Knip et al., 2010), coastal develop- ment (Beal et al., 2021; Jennings et al., 2008) and habitat loss or degradation (Jackson et al., 2014; Polidoro et al., 2010; Waycott et al., 2009). Some species in coastal habitats are also threatened by climate change and severe weather, which can affect abiotic conditions (Schlaff et al., 2014) that influence species distributions (Bangley et al., 2018; Hammerschlag et al., 2022) and finer-scale hab- itat use (Crear et al., 2020; Strickland et al., 2020), although species- specific responses may vary (Gutowsky et al., 2021). At present, the effects of climate change on sharks and rays in the WCA are poorly understood, but species that rely on habitats degraded by climate change may face the most significant impacts (e.g. reef-associated sharks; Heupel et al., 2019). High CoR also fell on international wa- ters and The Bahamas despite consisting of only oceanic habitats or being an insular nation, respectively. International waters, in particu- lar, cover a large proportion of the distributions of wide-ranging and highly threatened species in the WCA. The Bahamas also includes large expanses of threatened shark and ray habitat, supports high species richness that characterizes the Florida Straits region, and has a rich and relatively long-standing history of shark and ray research (e.g. Myrberg et al., 1969).
The WCA was previously one of the most data-deficient regions in the world for sharks and rays (Dulvy et al., 2014). The proportion of DD species dropped from 47% (n = 71 of 151 assessed species) in 2012 (Kyne et al., 2012) to just 1.1% (n = 2 of 180) in 2021, marking substantial progress in reducing data-deficient blind spots that can lead to flawed species-specific management (Walls & Dulvy, 2020). Seventy-seven species that we included in our review, some of which were not previously recognized in the WCA, were assessed as DD in 2012. Of those, the vast majority (76.6%, n = 59 of 77) are now LC and some (7.8%, n = 6 of 77) are now NT. Eleven (14.3%, n = 11 of 77) species formerly assessed as DD are now threatened at the global level, including two CR (Smalltail Shark [Carcharhinus porosus, Carcharhinidae] and Scoophead Shark [Sphyrna media, Sphyrnidae]), five EN (Bramble Shark [Echinorhinus brucus, Echinorhinidae], Lesser Devilray [Mobula hypostoma, Mobulidae], Chilean Devilray [Mobula tarapacana, Mobulidae], Venezuelan Dwarf Smoothhound and Atlantic Chupare) and four VU species (Bullnose Ray [Myliobatis freminvillei, Myliobatidae], Southern Eagle Ray [Myliobatis goodei, Myliobatidae], Brazilian Sharpnose Shark [Rhizoprionodon lalandii, Carcharhinidae] and Atlantic Nurse Shark). These 11 species should be recognized and incorporated into management plans in the WCA with an emphasis on the endemic Venezuelan Dwarf Smoothhound and near-endemic Atlantic Chupare.
The Roughskin Spurdog is the only previously assessed species that remains DD. It is a poorly known deepwater species (73–600 m depth range) that may be caught as bycatch, but the degree to which fishing affects its population is unknown (Finucci et al., 2020). The Carolina Hammerhead is the other modern DD species. It was re- cently described, is difficult to identify (Quattro et al., 2013) and was assessed as DD because its depth and geographic distribu- tion, and hence interaction with fisheries, could not be determined (VanderWright et al., 2020). Given that all other hammerhead sharks (Sphyrnidae) in the WCA are threatened, however, this sta- tus could be masking a high level of extinction risk to the Carolina Hammerhead.
Species of concern
The WCA hosts many threatened oceanic sharks (e.g. mackerel sharks [Lamnidae], thresher sharks [Alopiidae], and some requiem sharks [Carcharhinidae]) and rays (e.g. devil rays [Mobulidae]), particularly in the Gulf of Mexico and U.S. Atlantic (Dulvy, Pacoureau, et al., 2021; Pacoureau et al., 2021). They, along with hammerheads, sawfishes, guitarfishes (Rhinobatidae) and very large, highly migratory species (e.g. Whale Shark) are among the most threatened groups of sharks and rays in the region. Largetooth Sawfish (Pristis pristis, Pristidae) and Smalltooth Sawfish, for exam- ple, were historically found throughout the WCA's coastal habitats, but are now restricted to small portions of their previous ranges and have undergone severe population declines (Dulvy et al., 2016; Yan et al., 2021). All are recognized as groups of extreme conser- vation concern (Dulvy et al., 2016; Dulvy, Pacoureau, et al., 2021; Pacoureau et al., 2021). These species are prominent on CITES, CMS and SPAW Appendices and Annexes, which highlights the need for international cooperation in managing these species and for coun- tries to meet their national-level commitments to these agreements.
Among the four threatened endemics in the WCA, the VU Colombian Electric Ray and VU Brownband Numbfish are con- sidered irreplaceable because they also have small ranges (Dulvy et al., 2014). Although they are relatively productive, both species are captured in poorly managed and intense artisanal demersal trawl fisheries throughout their small geographic ranges in Colombia and Venezuela and are suspected to have declined by 30–49% over the past three generations (Pollom, Herman, Lasso-Alcalá, Mejía-Falla, & Navia, 2020a; Pollom, Herman, Lasso-Alcalá, Mejía-Falla, Navia, & Rincon, 2020). The other two threatened endemic species in the WCA are the EN Venezuelan Dwarf Smoothhound and the EN Venezuelan Round Ray. The former is targeted and caught as by- catch in trawl and longline fisheries off Venezuela and Colombia; it was inferred to have declined by >99% over the past three gen- erations based on declining landings of smooth-hounds (Triakidae) in Venezuela (Pollom, Lasso-Alcalá, et al., 2020). The latter is cap- tured in demersal trawl fisheries and artisanal beach seine fisheries in Colombia but is now rarely observed in catches in Venezuela; its population is suspected to have declined by 50–79% in the last ten years (Pollom, Herman, Lasso-Alcalá, Mejía-Falla, & Navia, 2020b).
The threatened near-endemic species (VU Painted Dwarf Numbfish, VU Freckled Guitarfish and EN Atlantic Chupare) are also subject to high fishing pressure in parts of their ranges (Dulvy, Charvet, et al., 2021; Pollom, Charvet, Blanco-Parra, et al., 2020; Pollom, Charvet, Faria, Herman, Lasso-Alcalá, Marcante, Mejía-Falla, et al., 2020). The Painted Dwarf Numbfish is captured in intense de- mersal trawl fisheries throughout its small range off northern South America from at least as far west as Venezuela to Brazil, but may find some refuge from fishing at depth (Pollom, Charvet, Faria, Herman, Lasso-Alcalá, Marcante, Mejía-Falla, et al., 2020). The Freckled Guitarfish has some refuge from trawl fisheries in the U.S. Gulf of Mexico, but is a common bycatch species in Mexican shrimp trawl fisheries and exposed to intense unmanaged fisheries elsewhere (Pollom, Charvet, Blanco-Parra, et al., 2020). The Atlantic Chupare similarly has refuge at the northern part of its range (e.g. The Bahamas), but is subject to high fishing pressure along the coasts of Venezuela, Colombia, the Guianas and northern Brazil, where it is presently very rare (Dulvy, Charvet, et al., 2021). Although we do not consider the CR Daggernose Shark (Isogomphodon oxyrhyn- chus, Carcharhinidae) or CR Wingfin Stingray (Fontitrygon geijskesi, Dasyatidae) near-endemic to the WCA, they are noteworthy for being highly threatened species with small ranges that extend from eastern Venezuela to the northern coast of Brazil (Dulvy et al., 2014; Pollom, Charvet, Faria, Herman, Lasso-Alcalá, Marcante, Nunes, & Rincon, 2020; Pollom, Charvet, Faria, Herman, Lasso-Alcalá, Marcante, Nunes, Rincon, & Kyne, 2020).
Research is required on the life history, distribution, abun- dance, and fishery interactions of these threatened endemic, near- endemic, and small-range species—the vast majority (77.8%, n = 7 of 9) of which are rays. Conservation responsibility for these species falls solely on countries in the WCA, namely Venezuela, Colombia, Suriname, Guyana, French Guiana and Brazil. We recommend that these countries monitor the status and prioritize the management of these species.
Fisheries trends
Shark and ray catches peaked in the WCA (1992) before they peaked globally (2003; Davidson et al., 2016; Pauly et al., 2020), but regional and global trends followed a similar pattern: there was a substantial increase in catches and landings from 1950 to the 1990s/2000s, fol- lowed by a period of decline. In the WCA, reconstructed catches declined 40.2% between 1992 and 2016 while overall fishing effort rose in the region by about 1.1% annually after 1950 (Anticamara et al., 2011). Thus, regional catch-per-unit-effort has probably de- clined by greater than 50% over the equivalent of three generations for many shark and ray species (which would result in a population reduction sufficient for a species to qualify as Endangered), suggest- ing fishing is driving their extinction risk in the WCA.
Finning
Some of the most intense shark fishing in the WCA occurred from the 1970s to the early 1990s (Bonfil, 1997; Musick et al., 1993) as negative attitudes towards sharks and the demand for and trade in shark fins increased (Castro, 2013; Worm et al., 2013). With in- creased demand, some local fin prices also rose, even quadrupling in Guatemalan markets by the mid-2000s (Graham, 2007). Numerous countries in the WCA participated in the fin trade (e.g. Guyana, Trinidad and Tobago; Fowler et al., 2005); 21% of CR Scalloped Hammerhead (Sphyrna lewini, Sphyrnidae) fins sampled in Hong Kong, for example, came from the western Atlantic (Chapman et al., 2009). But the global volume of fins imported into Hong Kong (i.e. demand) decreased by 2013 (Shea & To, 2017) and was expected to decrease further in both Hong Kong and China in subsequent years (Dent & Clarke, 2015). Fin prices also dropped in some parts of the WCA as the global trade in shark meat products increased 4.5% per year from 2000 to 2011 (Dent & Clarke, 2015). In some places, meat overtook fins as the most profitable shark product (e.g. north-eastern Brazil; Martins et al., 2018). By the mid-2010s, the contribution of Scalloped Hammerhead fins from the Southwest Atlantic, Caribbean Sea and Northwestern Atlantic randomly sampled in Hong Kong markets was roughly 8.5% (Fields et al., 2020). Silky Shark (Carcharhinus fal- ciformis, Carcharhinidae) fin trimmings similarly sampled in markets in Hong Kong and mainland China suggested almost no contribution from Atlantic populations (Cardeñosa et al., 2020) despite the Silky Shark being the second most common species in the fin trade at that time (Cardeñosa et al., 2018). These limited insights and a lack of evi- dence in the literature suggest little contemporary large-scale shark finning (the removal of fins and discarding of its carcass at sea) in the WCA (Kyne et al., 2012), although finning does occur illegally (e.g. finless carcasses are frequently landed at northern Brazilian ports notwithstanding national law; Feitosa et al., 2018). Fins from landed carcasses also enter the fin trade through legal pathways in even the WCA's most highly managed and developed fisheries (e.g. United States; Dulvy et al., 2017; Ferretti et al., 2020).
The importance of small-scale fisheries and catch data
Even at low levels of effort, small-scale fishing can significantly reduce the biomass and affect critical life stages (e.g. juveniles in possible nursery habitats; Tagliafico et al., 2021) of slow-growing fishes such as sharks and rays (Pinnegar & Engelhard, 2008). In the WCA, the size, economic contribution and catch of small-scale fleets have been increasing for decades (Baremore et al., 2021; Canty et al., 2019), and overfishing is occurring in nearly double the per- centage of small-scale fisheries (46%) as it is in commercial fisheries (28%; Singh-Renton & McIvor, 2015). The significance of small-scale fishing is highlighted by Mexico and Venezuela, which we identified as two of the top three shark and ray fishing nations in the WCA; small-scale fishing boats comprise 97% of the marine fishing fleet in Mexico (Fernández et al., 2011), and artisanal sources supply 94% of the shark catch in Venezuela (Marquez et al., 2019; Tavares, 2019). Yet, the WCA's small-scale fisheries are managed less intensely than its large-scale commercial fisheries (Singh-Renton & McIvor, 2015), and, for those affecting sharks and rays, small-scale fisheries are poorly known (Kyne et al., 2012), whereas large-scale fisheries are better-studied (e.g. see SouthEast Data, Assessment and Review reports, http://sedarweb.org/sedar-projects; Bonfil, 1997; Peterson et al., 2017; Tavares & Arocha, 2008).
The small-scale fisheries impacting sharks and rays in the WCA are heterogeneous and widespread, and their effort and catch are poorly described (Bonfil, 1997). We found surprisingly little infor- mation on ray discards and landings in the WCA and stress further monitoring despite few directed ray fisheries in the region outside of the United States, Cuba, and Mexico (Pérez-Jiménez & Mendez- Loeza, 2015; WECAFC, 2018). Further, the WCA's country-level landings statistics reported to the FAO have very low species- specific resolution (Dulvy et al., 2014; WECAFC, 2018), with over half of shark and ray catches identified as only ‘chondrichthyan’, ‘elasmobranch’, ‘batoid’ or ‘rajiform’. Mexico, despite being the third largest shark and ray fishing country in the WCA, records catches in only three categories—small sharks (<1.5 m), large sharks (>1.5 m) and rays (Pérez-Jiménez & Mendez-Loeza, 2015). Venezuela, despite being the second largest shark and ray fishing country in the WCA, recorded sharks and rays as a single category until 1990, then in three groups (miscellaneous sharks, Mustelus spp. and miscellaneous rays) until 2007, after which finer level identification was confounded by a lack of training for fisheries monitoring staff (Tavares, 2019). The situation in smaller shark and ray fishing nations is similar; in Guatemala, only two government fisheries staff monitor its entire ~150 km Caribbean coast, which hinders landings verification (Hacohen-Domené et al., 2020). Similarly, most fisheries research in Costa Rica has focused on the Pacific coast, and high-quality landings data are lacking for the Caribbean coast (Espinoza et al., 2018). This poor resolution is not compatible with effective species-specific management. Some recent studies have begun to fill these gaps by monitoring small-scale fisheries landings (e.g. Guyana—Kolmann et al., 2017; Venezuela—Marquez et al., 2019; Panama—Návalo et al., 2021). In the Belizean shark fishery, for example, a new low-cost method of analysing fisher-contributed secondary shark fins was successful in determining species and size composition of landings (Quinlan et al., 2021). Ultimately, increased reporting of on-shore landings and at-sea discards in small-scale and large-scale fisheries is criti- cal; together, unreported landings (1,354,655 mt) and unreported discards (415,996 mt) comprised 59.5% of all shark and ray catches in the WCA from 1950 to 2016. Complete, high-resolution effort and catch data are required to assess populations and adapt man- agement priorities (Bizzarro et al., 2009; Kyne et al., 2012; Pérez- Jiménez & Mendez-Loeza, 2015).
Shrinking refuge at depth
Since 1950, global fisheries have increasingly expanded into the deep sea (Morato et al., 2006). In the Atlantic Ocean, deepwater sharks like gulper sharks (Centrophoridae) and kitefin sharks (Dalatiidae) occurring as deep as 1000 m were reported in fisheries landings as early as 1990 (Morato et al., 2006). Although we found many en- demic and LC species in the WCA to be associated with deep habi- tats that can provide refuge from fishing pressure (Dulvy et al., 2014, Dulvy, Pacoureau, et al., 2021; Walls & Dulvy, 2021), this refuge may be shrinking as fishing activities continue to develop in the region's deep waters (Arana et al., 2009; Baremore et al., 2016).
In the WCA, many deepwater habitats (>200 m) are acces- sible to small-scale fishers due to the proximity of these habi- tats to shore, and, consequently, deepwater sharks and rays are already caught as bycatch and sometimes targeted. Along the Mesoamerican Barrier Reef, for example, this access coupled with declining yields in coastal fisheries led to the emergence of small- scale deepwater fisheries that use longlines, hook and line, traps, and gillnets to target ‘red snappers’ (e.g. Queen Snapper [Etelis oculatus, Lutjanidae], Silk Snapper [Lutjanus vivanus, Lutjanidae], Blackfin Snapper [Lutjanus buccanella, Lutjanidae]) and groupers (e.g. Yellowedge Grouper [Hyporthodus flavolimbatus, Serranidae], Misty Grouper [Hyporthodus mystacinus, Serranidae]) between 100 and 550 m (Baremore et al., 2021; WECAFC, 2018). Most small-scale deepwater fisheries in the WCA similarly target this snapper and grouper complex. Off Guatemala, fishers catch and discard some small deepwater sharks and chimaeras, while they target or retain others for meat or liver oil (Finucci et al., 2021; Hacohen-Domené et al., 2020; Polanco-Vásquez et al., 2017). In Venezuela, overfish- ing of shallow-water stocks has led to deepwater (200–800 m) fish- ing north of Isla de Margarita and Paria Peninsula (eastern region, near Trinidad) and along the coast of Falcón (western region, near Aruba), where endemic and near-endemic species of deepwater sharks, rays and chimaeras are now caught (OM Lasso-Alcalá, un- published data). Deepwater sharks are also caught off Saba Bank (de Graaf et al., 2017), Curaçao (Van Beek et al., 2013), Belize (Quinlan et al., 2021), northern Cuba (Ruiz-Abierno et al., 2021) and in the southern Gulf of Mexico (albeit very few; Pérez-Jiménez & Mendez- Loeza, 2015) and targeted in Honduras (Baremore et al., 2016). In the northern Gulf of Mexico, deep reef-fish longline fisheries and shrimp trawl fisheries also catch deepwater sharks as bycatch, most of which are discarded (Scott-Denton et al., 2011; Scott-Denton & Williams, 2013; Zhang et al., 2014), and, in The Bahamas, recre- ational fishers often catch small deepwater sharks while targeting red snappers with electric reels (BS Talwar, pers. obs.). Across these WCA fisheries, the Dusky Smoothhound (Mustelus canis, Triakidae; NT), Cuban Dogfish (Squalus cubensis, Squalidae; LC), Atlantic Sixgill Shark (Hexanchus vitulus, Hexanchidae; LC), Sharpnose Sevengill Shark (Heptranchias perlo, Hexanchidae; NT), Night Shark (EN), gulper sharks (Centrophorus spp., Centrophoridae; EN where assessed) and some catsharks (Scyliorhinidae; LC) are the most common deepwa- ter species in landings (Baremore et al., 2021; de Graaf et al., 2017; Hacohen-Domené et al., 2020; Marquez et al., 2019; Quinlan et al., 2021; Scott-Denton et al., 2011; Van Beek et al., 2013).
Although many of the WCA's deepwater sharks and rays are currently assessed as LC, our knowledge of their biology and ecology remains incredibly limited. These species also typically lack stock assessments (Table S1; Baremore et al., 2021; Kyne & Simpfendorfer, 2010), and many are intrinsically vulnerable to overfishing due to their life histories (García et al., 2008; Rigby & Simpfendorfer, 2015; Simpfendorfer & Kyne, 2009). Thus, a precau- tionary approach to their management should be emphasized if deep- water fisheries are further developed in the WCA (Simpfendorfer & Kyne, 2009), which some governments appear to be pursuing (e.g. Belize; Baremore et al., 2021; Kyne et al., 2012).
Management opportunities and priorities
The WCA is geopolitically complex, with more maritime boundaries in the Caribbean alone than in any other Large Marine Ecosystem (Martinez et al., 2017). It also contains highly developed, large countries with extensive fisheries management regimes (e.g. United States) alongside economically challenged small island developing states with limited management capacity (e.g. Haiti). Nutrient-rich continental shelves host industrial fisheries while nutrient-poor coral reefs support artisanal fisheries a short distance away (Singh- Renton & McIvor, 2015). It is not surprising that approaches to shark and ray management vary widely in the region and that challenges to improved management and regular stock assessment include con- sistency and harmonization in data collection, fisheries monitoring, funding, training and enforcement. Our findings underscore the ob- jectives of the WECAFC RPOA–Sharks in meeting these challenges (WECAFC, 2018).
Conservation responsibility (CoR), management engagement (ME) and reconstructed catches should be interpreted carefully, but, taken together, they can provide a blueprint for regional man- agement priorities and leadership. We emphasize that CoR re- flects contemporary-regional species distributions weighted by contemporary-global levels of extinction risk. It is important to con- sider, for example, that primary drivers of extinction risk to species that occur in the WCA are sometimes outside of the WCA (e.g. Whale Shark population declines are largest in the Indo-Pacific, where the bulk of the global population occurs; Pierce & Norman, 2016). Contemporary ME also reflects current national and international policies, which can change regularly. Further, each country's total re- constructed catch reflects historical-regional shark and ray catches; catches may be substantial outside of the WCA, but were not con- sidered here. The Sea Around Us Project also offers catch data at the best resolution available by improving often low-resolution and sometimes incomplete data that countries self-report to the FAO (Maharaj et al., 2018). Colombia's reconstructed catch data for sharks and rays is underestimated, for example, because Colombia does not report ray catches from large-scale fisheries, and many years of shark and ray landings data are missing from government records (Caldas et al., 2009). Despite reconstructed catch data for Colombia showing no ray catches from 1950 to 2016, recent data indicate that rays represent 7.2% of the total volume of small-scale fish and in- vertebrate catches at three locations in the Colombian Caribbean (Squalus Foundation—AUNAP, unpublished data). Still, most fishing in the Colombian Caribbean is small-scale and results in far fewer shark and ray catches than in the WCA's major shark and ray fish- ing nations (PA Mejía-Falla, pers. obs.). Similarly, self-reported catch data from Venezuela are flawed after 1998, when record-keeping by the national fisheries monitoring agency became unreliable due to the collapse of government infrastructure (Tavares, 2019). Tavares (2019) indicated that all Venezuelan commercial fishery pro- duction in the Caribbean Sea declined ~80% from the 1990s to the 2010s, particularly due to fuel shortages that led to reduced fishing capacity in the mid-2010s. However, in recent decades, the national fisheries monitoring agency artificially masked low reported catches of sharks and rays from poorly-reported fisheries by submitting in- flated catch data to international organizations (e.g. FAO; R. Tavares, pers. comm). This brings into question the apparent spike in regional shark catches from 2010 to 2011, driven largely by a 451% increase in reported Venezuelan catches, and shortly thereafter an apparent spike in regional ray catches from 2014 to 2015, driven largely by a 271% increase in reported Venezuelan catches (Figure 8; Page et al., 2020). Without these noticeable increases in regional catches towards the end of these series, there would be more consistency in the regional trends for declining shark catches and plateauing ray catches in recent decades.
The countries that dominate CoR and total reconstructed catches in the WCA—the United States, Venezuela and Mexico—have large expanses of nutrient-rich continental shelf that are expected to sup- port high shark and ray diversity, abundance and catches. As such, leading in either category does not necessarily indicate current over- fishing or inadequate management of threatened species. For exam- ple, despite leading the WCA in both CoR and total reconstructed catches, the United States currently offers some of the best exam- ples of sustainable shark and ray fishing in the world and acts as a refuge for many threatened sharks and rays (Ferretti et al., 2020; Simpfendorfer & Dulvy, 2017), some of which have experienced preliminary recoveries in U.S. waters (Peterson et al., 2017). Alternatively, Mexico and Venezuela host data-poor fisheries where reference points and stock status are largely unknown, and institu- tional management capacity is lacking (Pérez-Jiménez & Mendez- Loeza, 2015; Tavares, 2019). Mexico, for example, is not a party to SPAW, CMS or CMS Sharks MoU. Roughly half of all countries in the WCA have higher ME than Venezuela and Mexico.
The WCA's other major historical shark and ray fishing nations (e.g. Cuba, Dominican Republic and Jamaica) and those with high CoR (e.g. Guyana, Suriname and The Bahamas) also stand out as having significant responsibility for managing sharks and rays (Figure 10b). Of these, Jamaica and Suriname have the lowest ME and require increased engagement. Haiti's lack of shark and ray management also requires immediate action. Although countries with small EEZs tend to have relatively low CoR and few catches, some are located in areas of high species richness and may provide refuge from fishing pressure in adjacent EEZs. Aruba, for instance, hosts the highest di- versity of large coastal shark species among Dutch Caribbean coun- tries (Winter & de Graaf, 2019) and shares ~50% of its borders with Venezuela, making it uniquely positioned to provide disproportion- ate conservation benefits given its small size. Unfortunately, Aruba has very low ME despite its close neighbour Bonaire—also part of the Kingdom of the Netherlands—having high ME. Lastly, the high CoR of international waters calls attention to the importance of manag- ing highly migratory sharks and rays through international fisheries management bodies (Tavares & Arocha, 2008; Walls & Dulvy, 2021). Given 100% participation of WCA countries in WECAFC, its up- coming RPOA–Sharks provides a unique opportunity to achieve that end, particularly given WECAFC's broad taxonomic and geo- graphic jurisdiction. In comparison, ICCAT's jurisdiction is limited to oceanic species caught by fleets targeting tuna and tuna-like fishes (WECAFC, 2018). However, WECAFC does not currently have the authority to adopt binding management measures.
Improved enforcement is required in much of the WCA, partic- ularly in small-scale fisheries (Kyne et al., 2012; Martins et al., 2018; Saavedra-Díaz et al., 2016). Sharks and rays are caught and landed despite protected status in numerous countries (Feitosa et al., 2018; Gallagher et al., 2015; Van Beek et al., 2013). Along Guatemala's Caribbean coast, limited fisheries patrols and a lack of funding for enforcement have resulted in unregulated fishing in Guatemalan waters and roving bandit dynamics in neighbouring EEZs, such as Belize and Honduras (Berkes et al., 2006; Graham, 2007; Hacohen- Domené et al., 2020). Shark fins may also move across international borders to be sold in poorly regulated markets (Kyne et al., 2012). Ineffective management and enforcement of marine protected areas (MPAs) is also common (Bustamante et al., 2014; Perera-Valderrama et al., 2018). In addition, extractive activities are allowed in many MPAs; only 0.5% of the protected areas in the Caribbean associ- ated with European Union and UK Overseas Territories prohibit all extractive activities (Martinez et al., 2017). Generally, funding for enforcement is insufficient and the detection of illegal activ- ity is too infrequent to encourage compliance (although it varies by sub-region; Singh-Renton & McIvor, 2015). At the international level, even when a country is party to an international agreement or treaty, it may not have implemented national regulations to meet its commitments (which are sometimes voluntary or non-binding; e.g. IPOA–Sharks, CMS Sharks MoU; Fischer et al., 2012). The fol- lowing WCA countries, for example, either partially meet or do not meet their mandatory commitments to protected sharks and rays on CMS Appendix I: Antigua and Barbuda, Cuba, Costa Rica, Honduras, Jamaica, Netherlands (Aruba and Curaçao), Panama and the United Kingdom (Bermuda, Anguilla, Montserrat, and the Turks and Caicos) (Lawson & Fordham, 2018).
Although we focused primarily on fisheries, national priorities can be established using other value frameworks that provide al- ternative justification for shark and ray management. Shark and ray tourism, for example, can offer a profitable, non-consumptive alternative to fishing for some species and some people (Gallagher & Hammerschlag, 2011; Kyne et al., 2012). The Bahamas provides an example of how a small island developing state without sufficient fisheries management and enforcement (Sherman et al., 2018) is still able to benefit from the non-extractive use of sharks and rays. As a regional leader in shark and ray ecotourism, it boasts the world's largest shark diving economy, which generates $113.8 million USD annually (Haas et al., 2017). Although The Bahamas has a rich and abundant shark and ray fauna, over 90% of national expenditures from shark dives came from those focused on the Caribbean Reef Shark (Carcharhinus perezi, Carcharhinidae; Haas et al., 2017), which is one of the most abundant and ubiquitous reef-associated sharks in effectively managed areas in the WCA (MacNeil et al., 2020) and also offers tourist appeal in other locations (e.g. Belize; Graham, 2014). The Cayman Islands offers another long-standing example of suc- cessful non-extractive use; Stingray City, off Grand Cayman, fea- tures tens of Southern Stingrays (Hypanus americanus, Dasyatidae) that interact with tourists in what may be the oldest example of shark and ray tourism in the world (Ormond et al., 2016). This site plays a major role in ray-specific tourism and generates up to $50 million USD annually for the Cayman Islands (Vaudo et al., 2018); shark-associated diving and non-extractive use generates an ad- ditional $46.8–62.6 million USD every year (Ormond et al., 2016). Although shark and ray ecotourism is not without its challenges (Gallagher & Huveneers, 2018), under the right circumstances it can have a net conservation and economic benefit (Gallagher et al., 2015) and may be appropriate for countries with low recon- structed catches and high CoR (e.g. Colombia).
CONCLUSIONS
Sharks and rays are among the most threatened vertebrates on our planet, second only to the amphibians (Dulvy, Pacoureau, et al., 2021). Protecting CR and EN sharks and rays from fishing, par- ticularly endemic and near-endemic species, remains a regional and global priority (Dulvy, Pacoureau, et al., 2021). Unmonitored small- scale fisheries in the WCA likely contribute heavily to shark and ray population declines and may grow to threaten some shelf-associated deepwater species. Effective and enforceable fisheries management informed by basic species-specific data on abundance and catch is urgently required across the WCA. Managing shark and ray fisheries has the potential to reduce mortality, halt declines, and promote re- covery while supporting food security and livelihoods through sus- tainable fishing of less-threatened species (Booth et al., 2019; Dulvy, Pacoureau, et al., 2021). A robust management toolbox is available to achieve that end (Booth, Squires, & Milner-Gulland, 2020; MacNeil et al., 2020), but improved implementation of locally appropriate tools is required (Davidson et al., 2016).